- 1. Identification and Annotation of significant interaction
- 1.1 Input parameters
- 1.2 Output
- 1.3 Result Adjustment
- 1.4 Result Interpretation
- 2. Visualization of chromatin interaction
- 2.1 Input parameters
- 2.2 Output
- 2.3 Result Adjustment
- 3. Comparative visualization of chromatin interaction
- 3.1 Input parameters
- 3.2 Output
- 3.3 Result Adjustment
- 3.4 Result Interpretation
- 4. Session Save/Load and Visualization Export
- 4.1 Save session as a file
- 4.2 Load session from a file
- 4.3 Export Figures
● Session 1 : Identification and Annotation of significant interaction
Hi-C, high-throughput chromatin conformation capture (3C), is a most-widely used genome-wide molecular assay that identify long-range chromatin interactions. Genomic and epigenomic contexts may assist functional interpretation of the identified interactions. In this regard, 3DIV provides a list of interaction partners of queried loci together genomic/epigenomic annotations. In this tutorial, we provide an example with rs1421085 SNPs in H1-derived mesenchymal stem cell since this SNP is well characterized by significant interactions with IRX3 and IRX5 gene promoters.- Input parameters
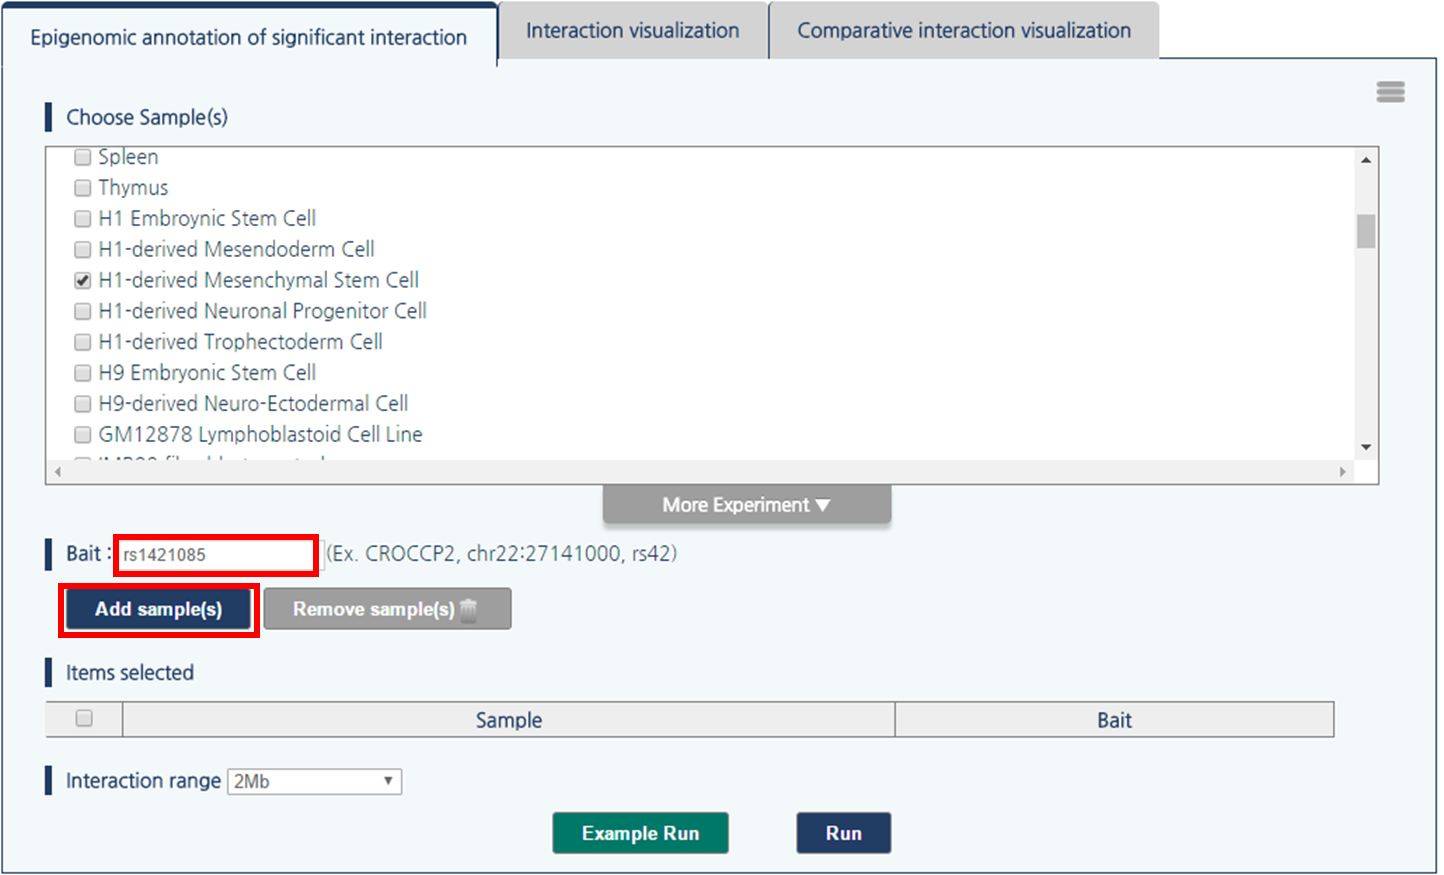
1) Click “more experiment” button to load the full list of samples.
2) Select H1-derived Mesenchymal Stem Cell by clicking the checkbox.

3) 3DIV allows users to pass the gene names or SNP ID, as well as genomic coordinates as the query. Type rs1421085 and click “Add Sample(s)” button.
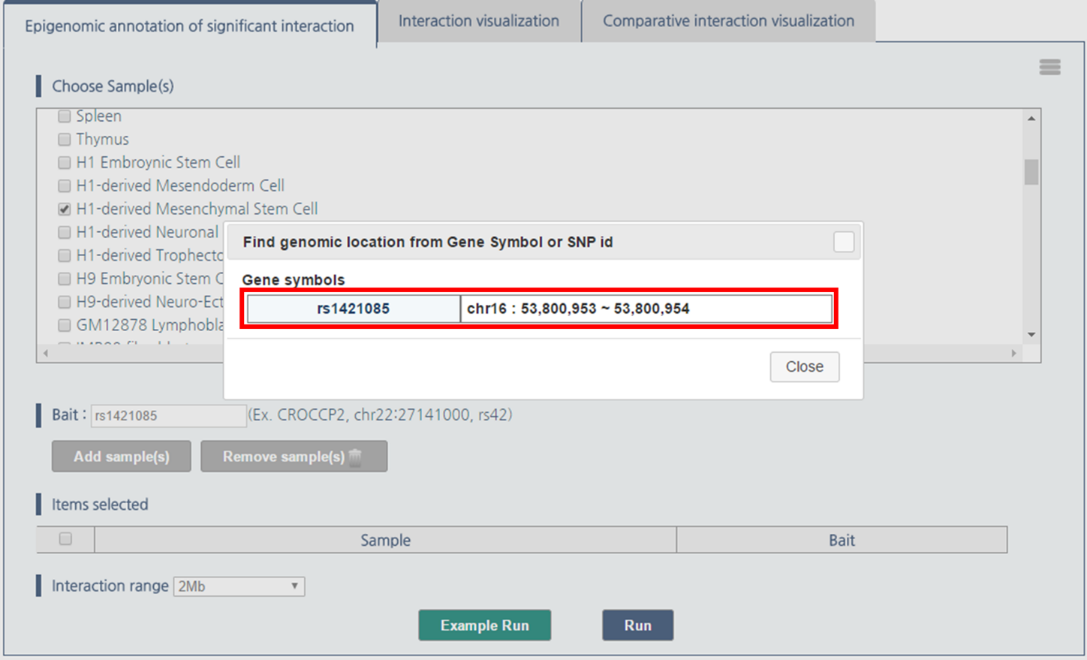
4) Click “rs1421085” to pass rs1421085 variant as the query.
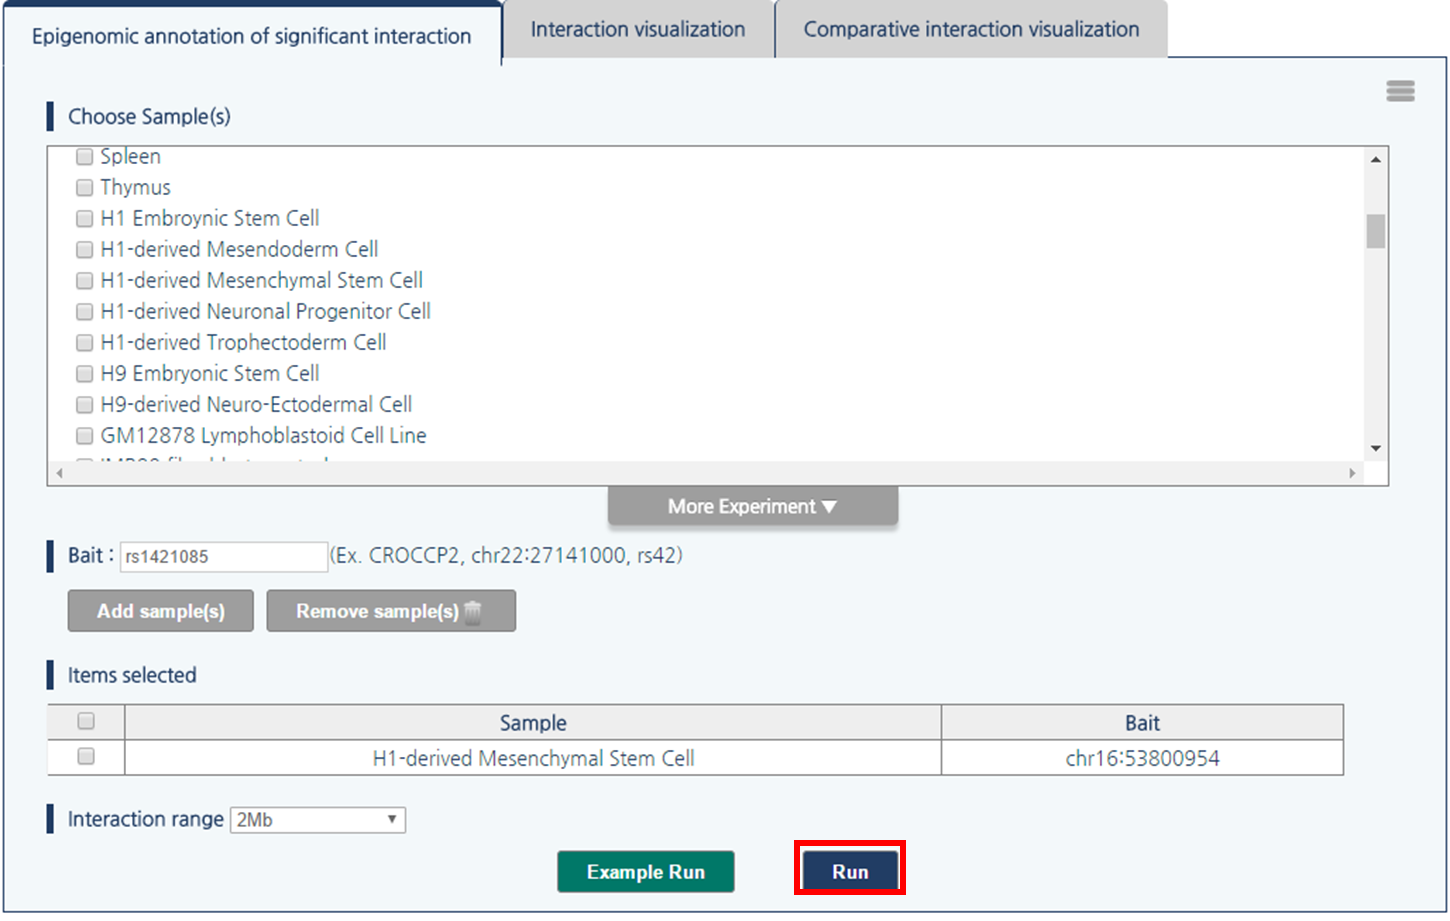
5) Then, click “Run” button.
- Output
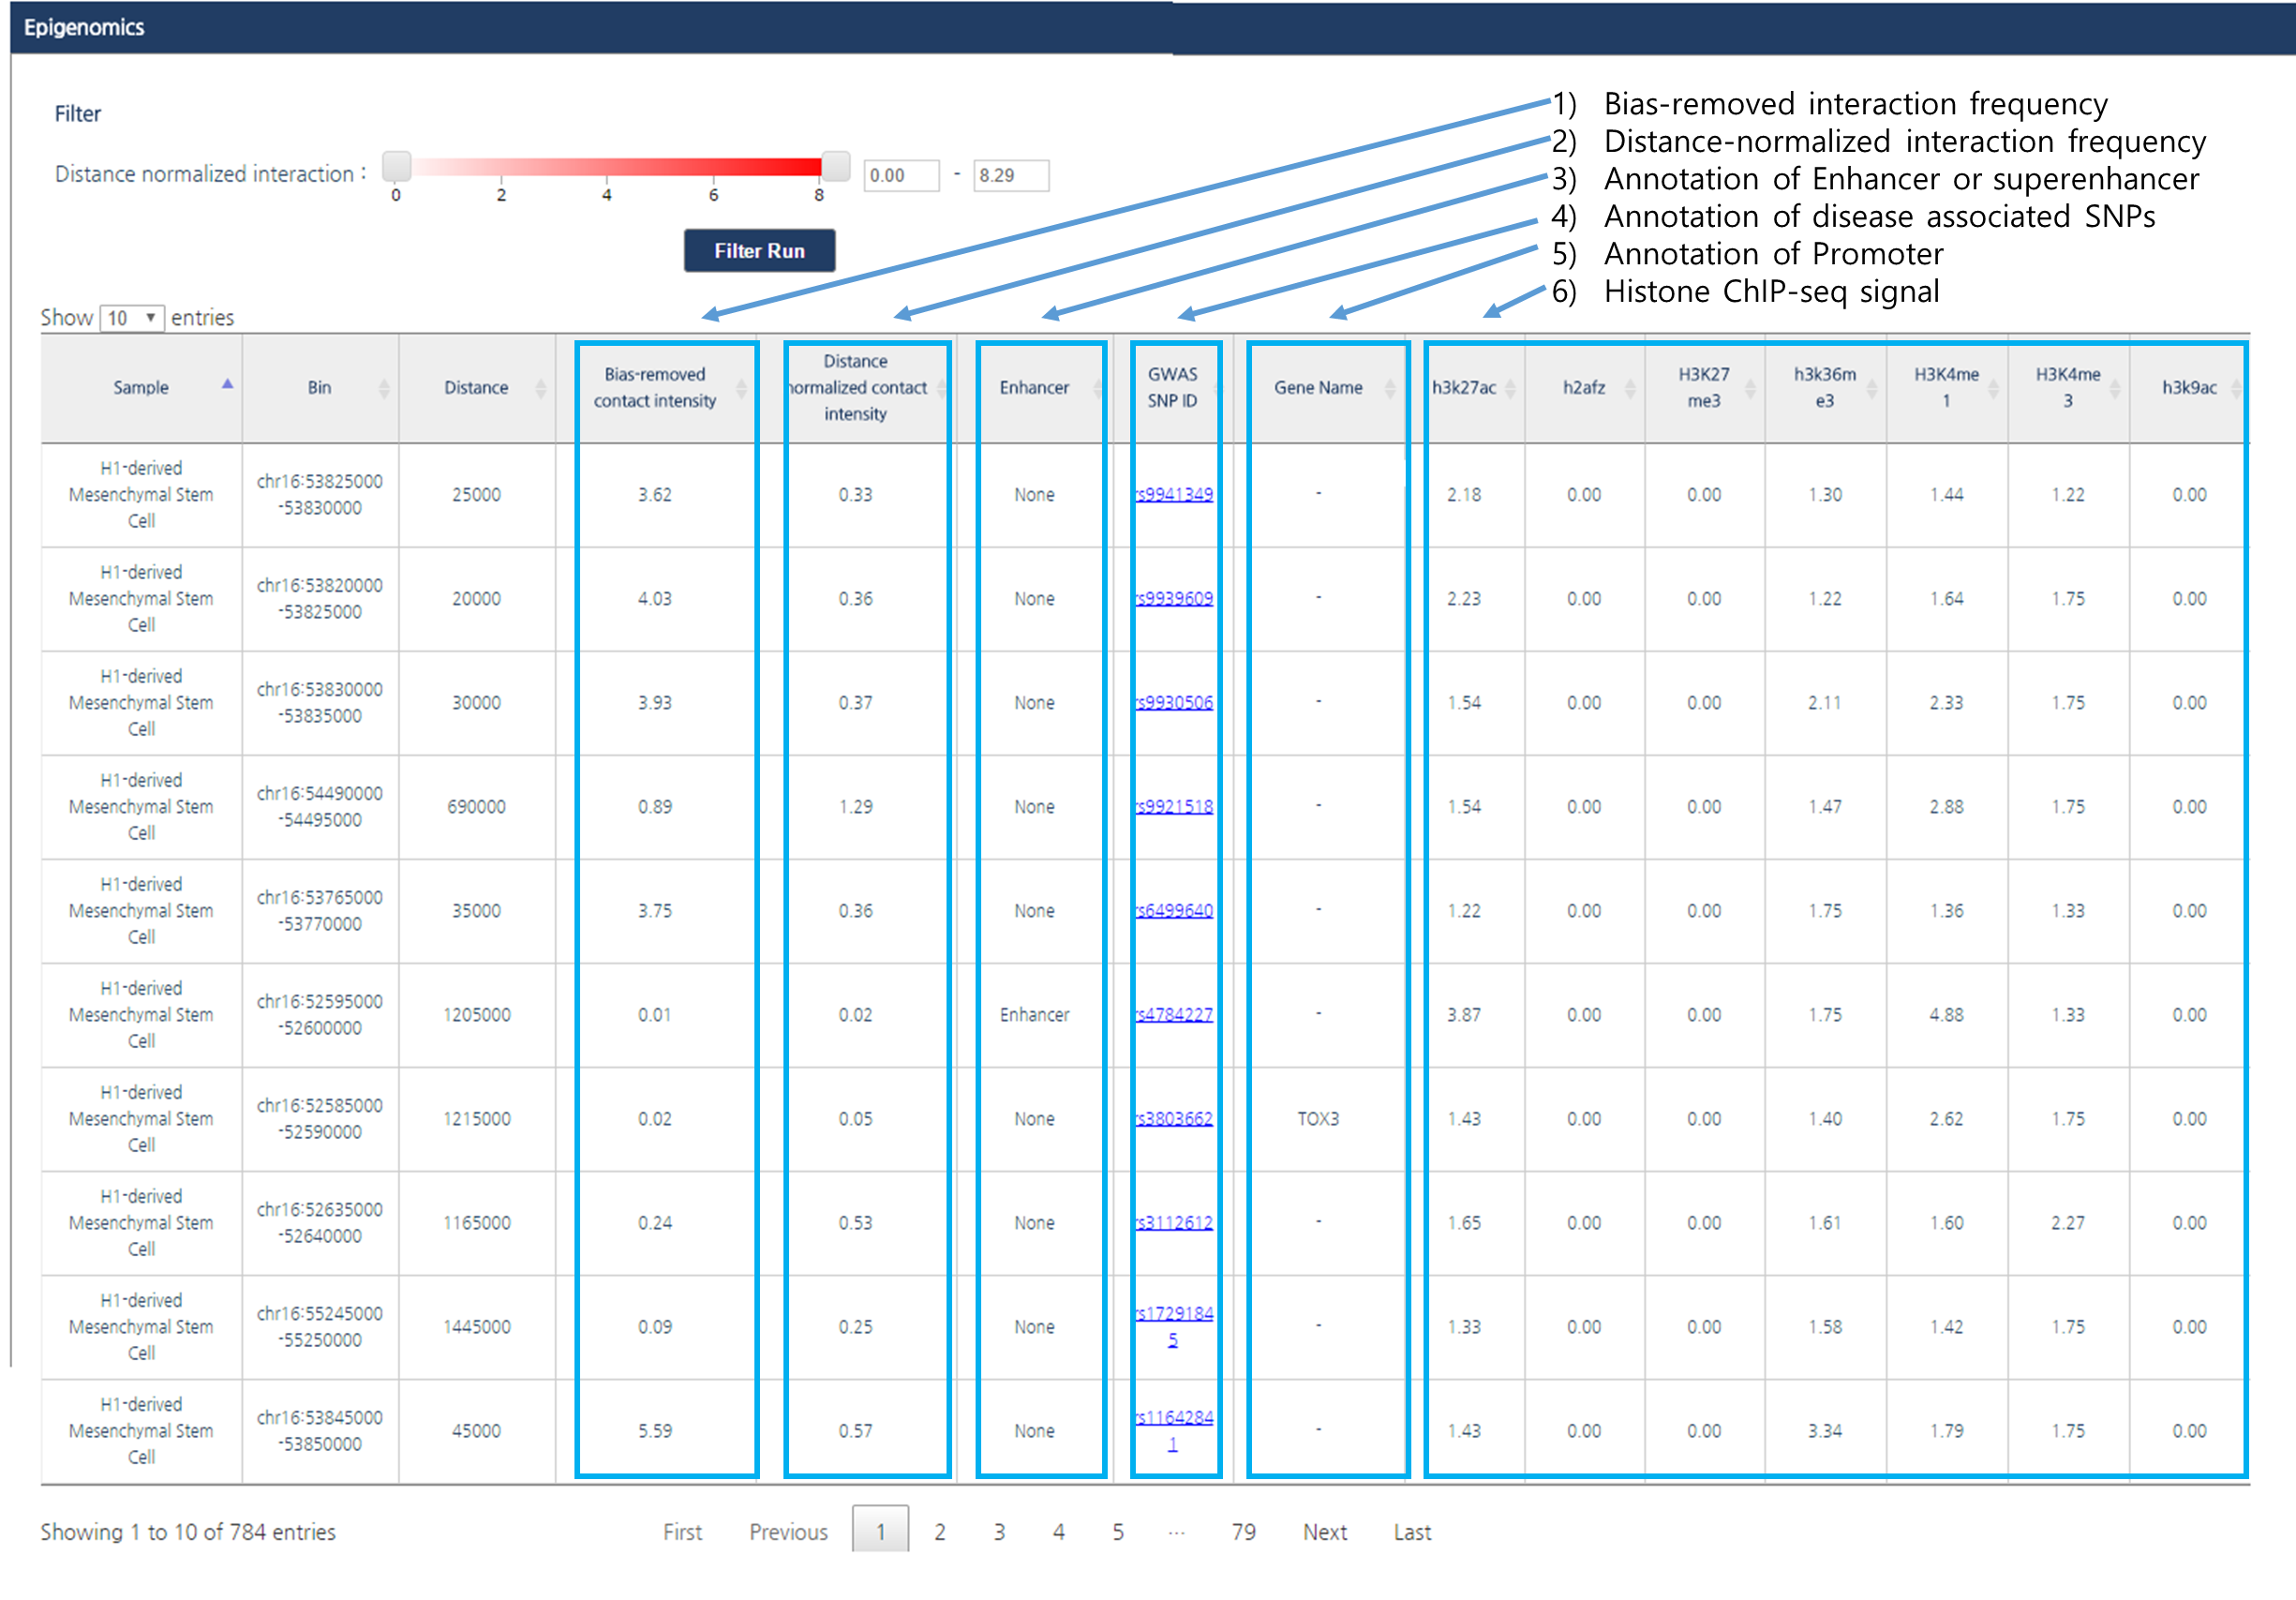
The output table contains following information; experimental bias-removed interaction frequency, distance-normalized interaction frequency, annotation of enhancers or super-enhancers, disease associated SNPs, and corresponding gene name for a promoter. Fold changes between FPKM of multiple histone ChIP-seq and input are also provided.Bias-removed interaction frequency indicates experimental bias-removed interaction frequencies from raw Hi-C data, defined as the ratio between observed interaction frequency and expected interaction frequency. We also provide distance-normalized interaction frequencies to identify biologically meaningful interactions with LOESS regression model.
- Result Adjustment
1) By dragging the scroll bar for the cutoff value of distance ligation frequency at the top of the page and click “Filter Run” button, you can change the value of cutoff to be listed in the result table. In this tutorial, we used the criteria 2.0, in other word only interactions whose bias-remove interaction frequency is greater than two-fold of background will be listed.
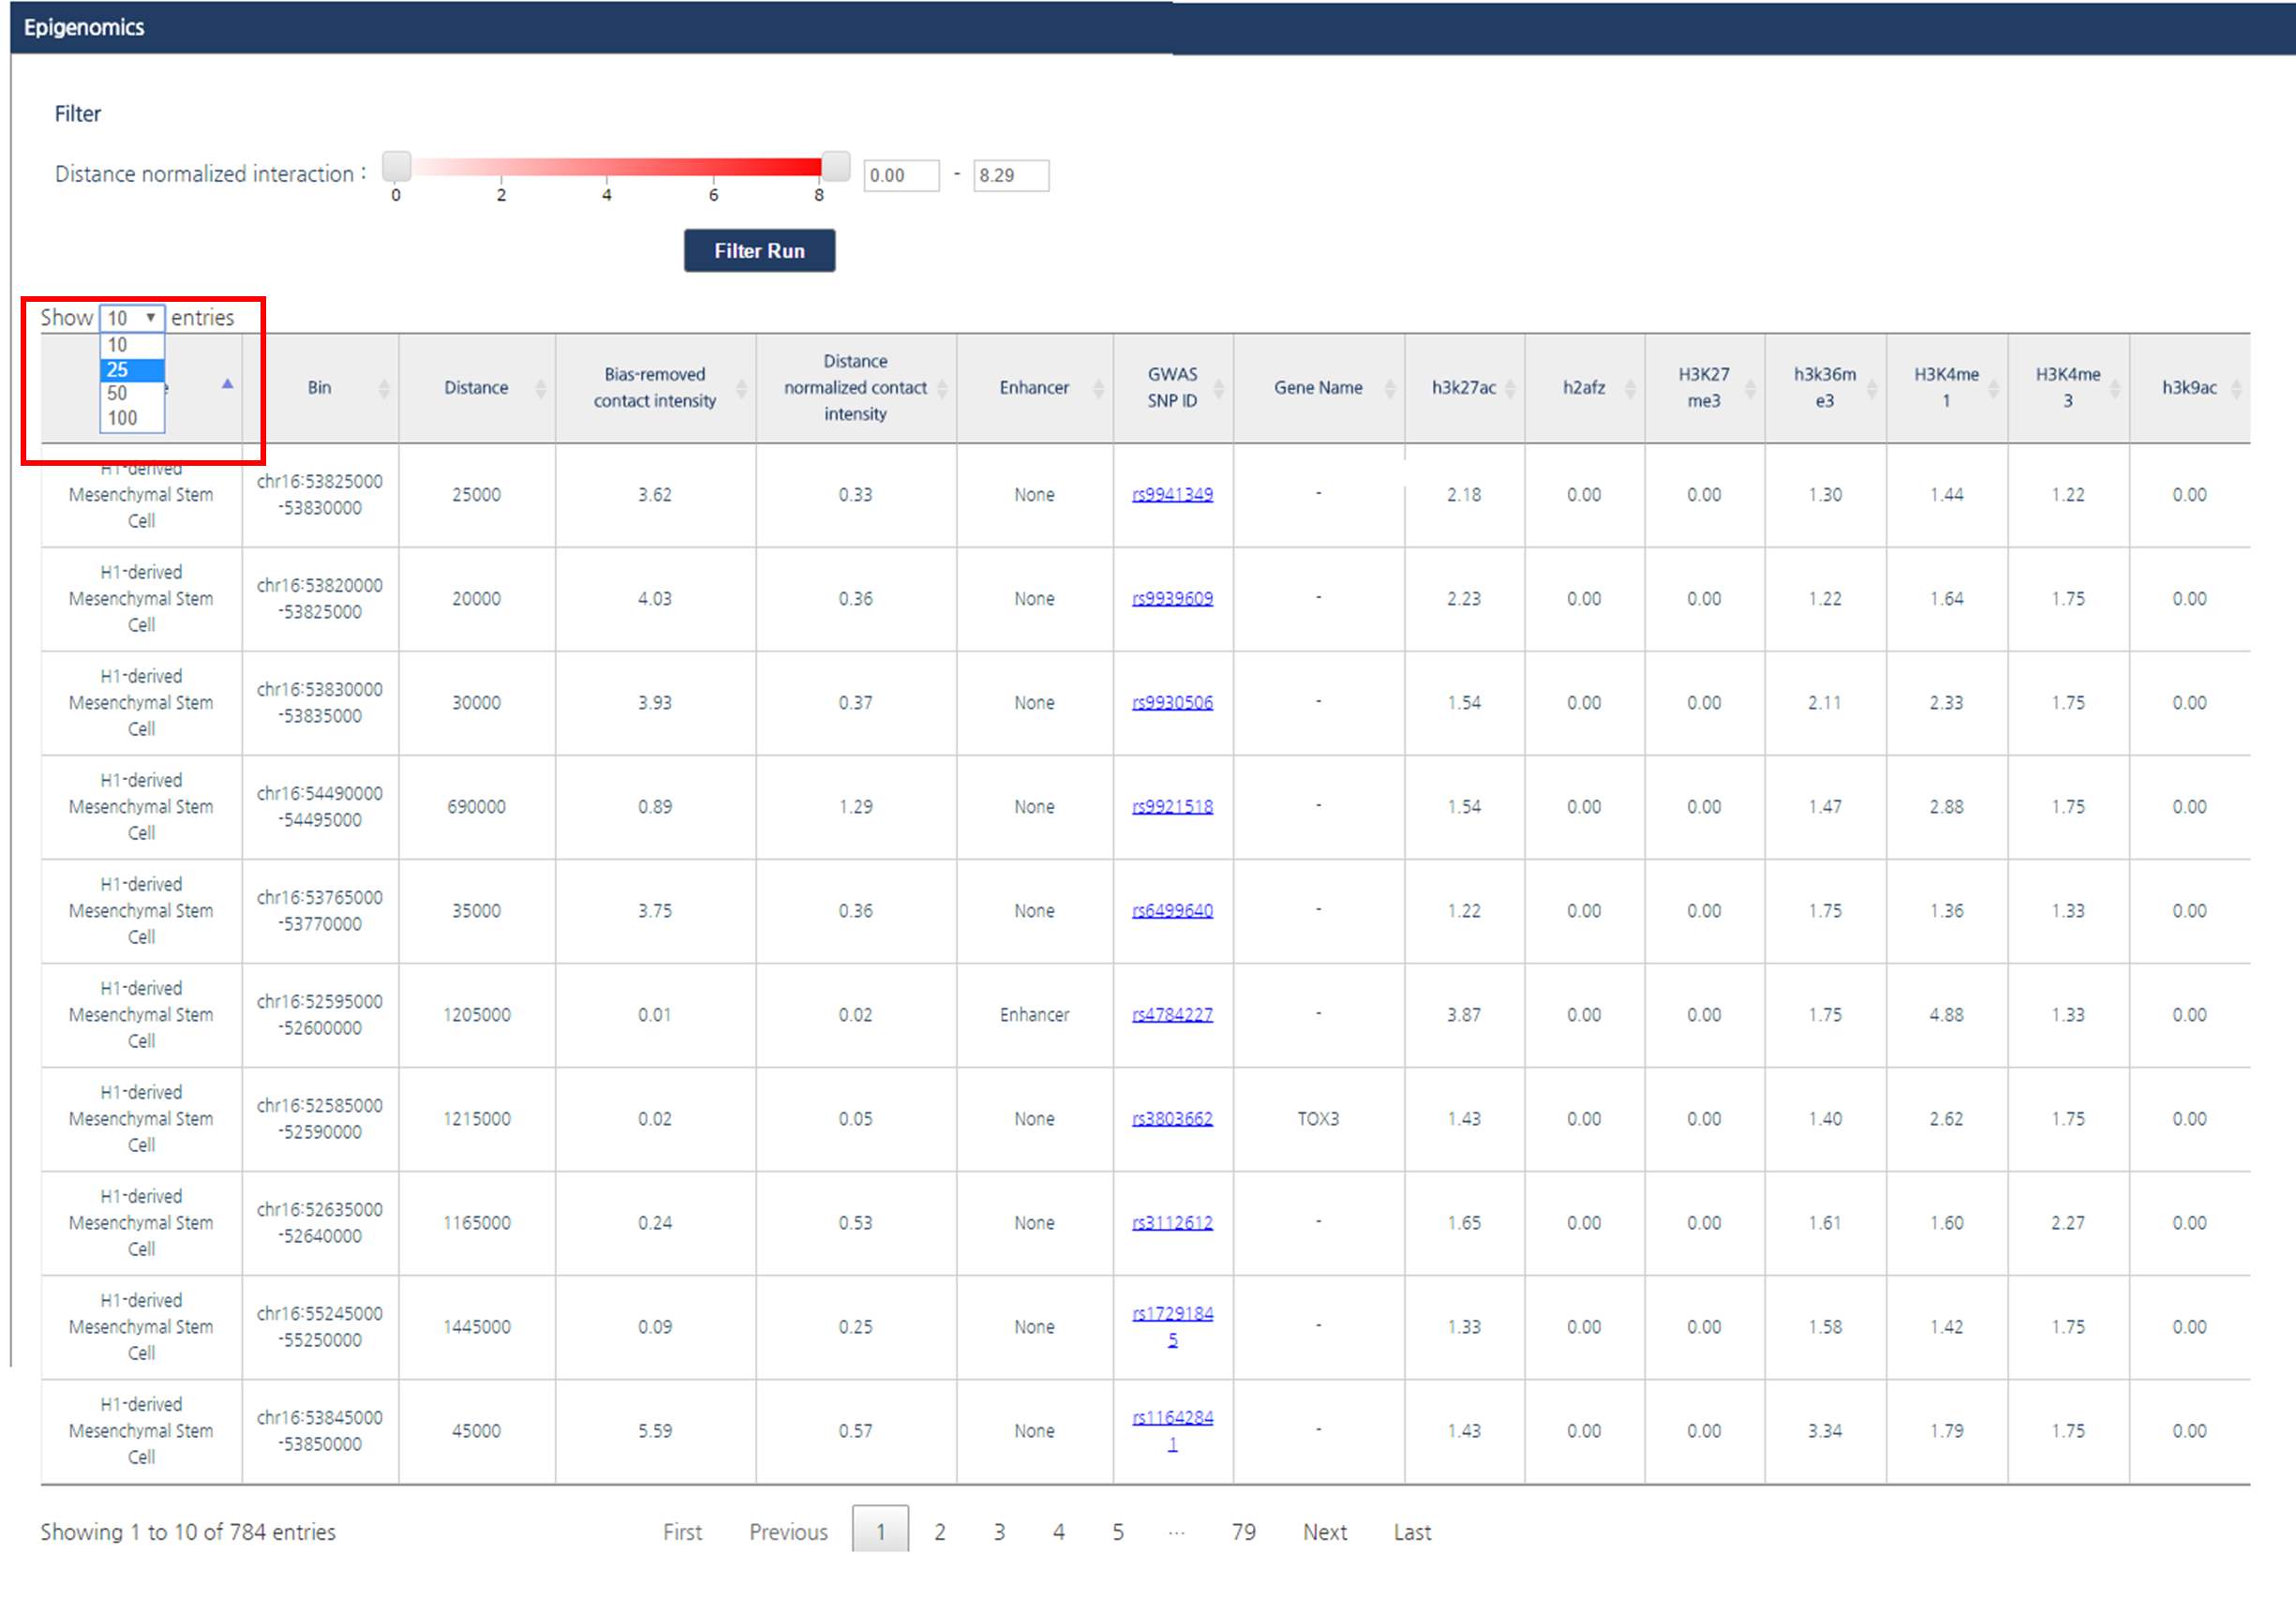
2) The number of entries per page can be adjusted by clicking on the drop-down button located above the interaction table. In this tutorial, we applied 25 entries per page.
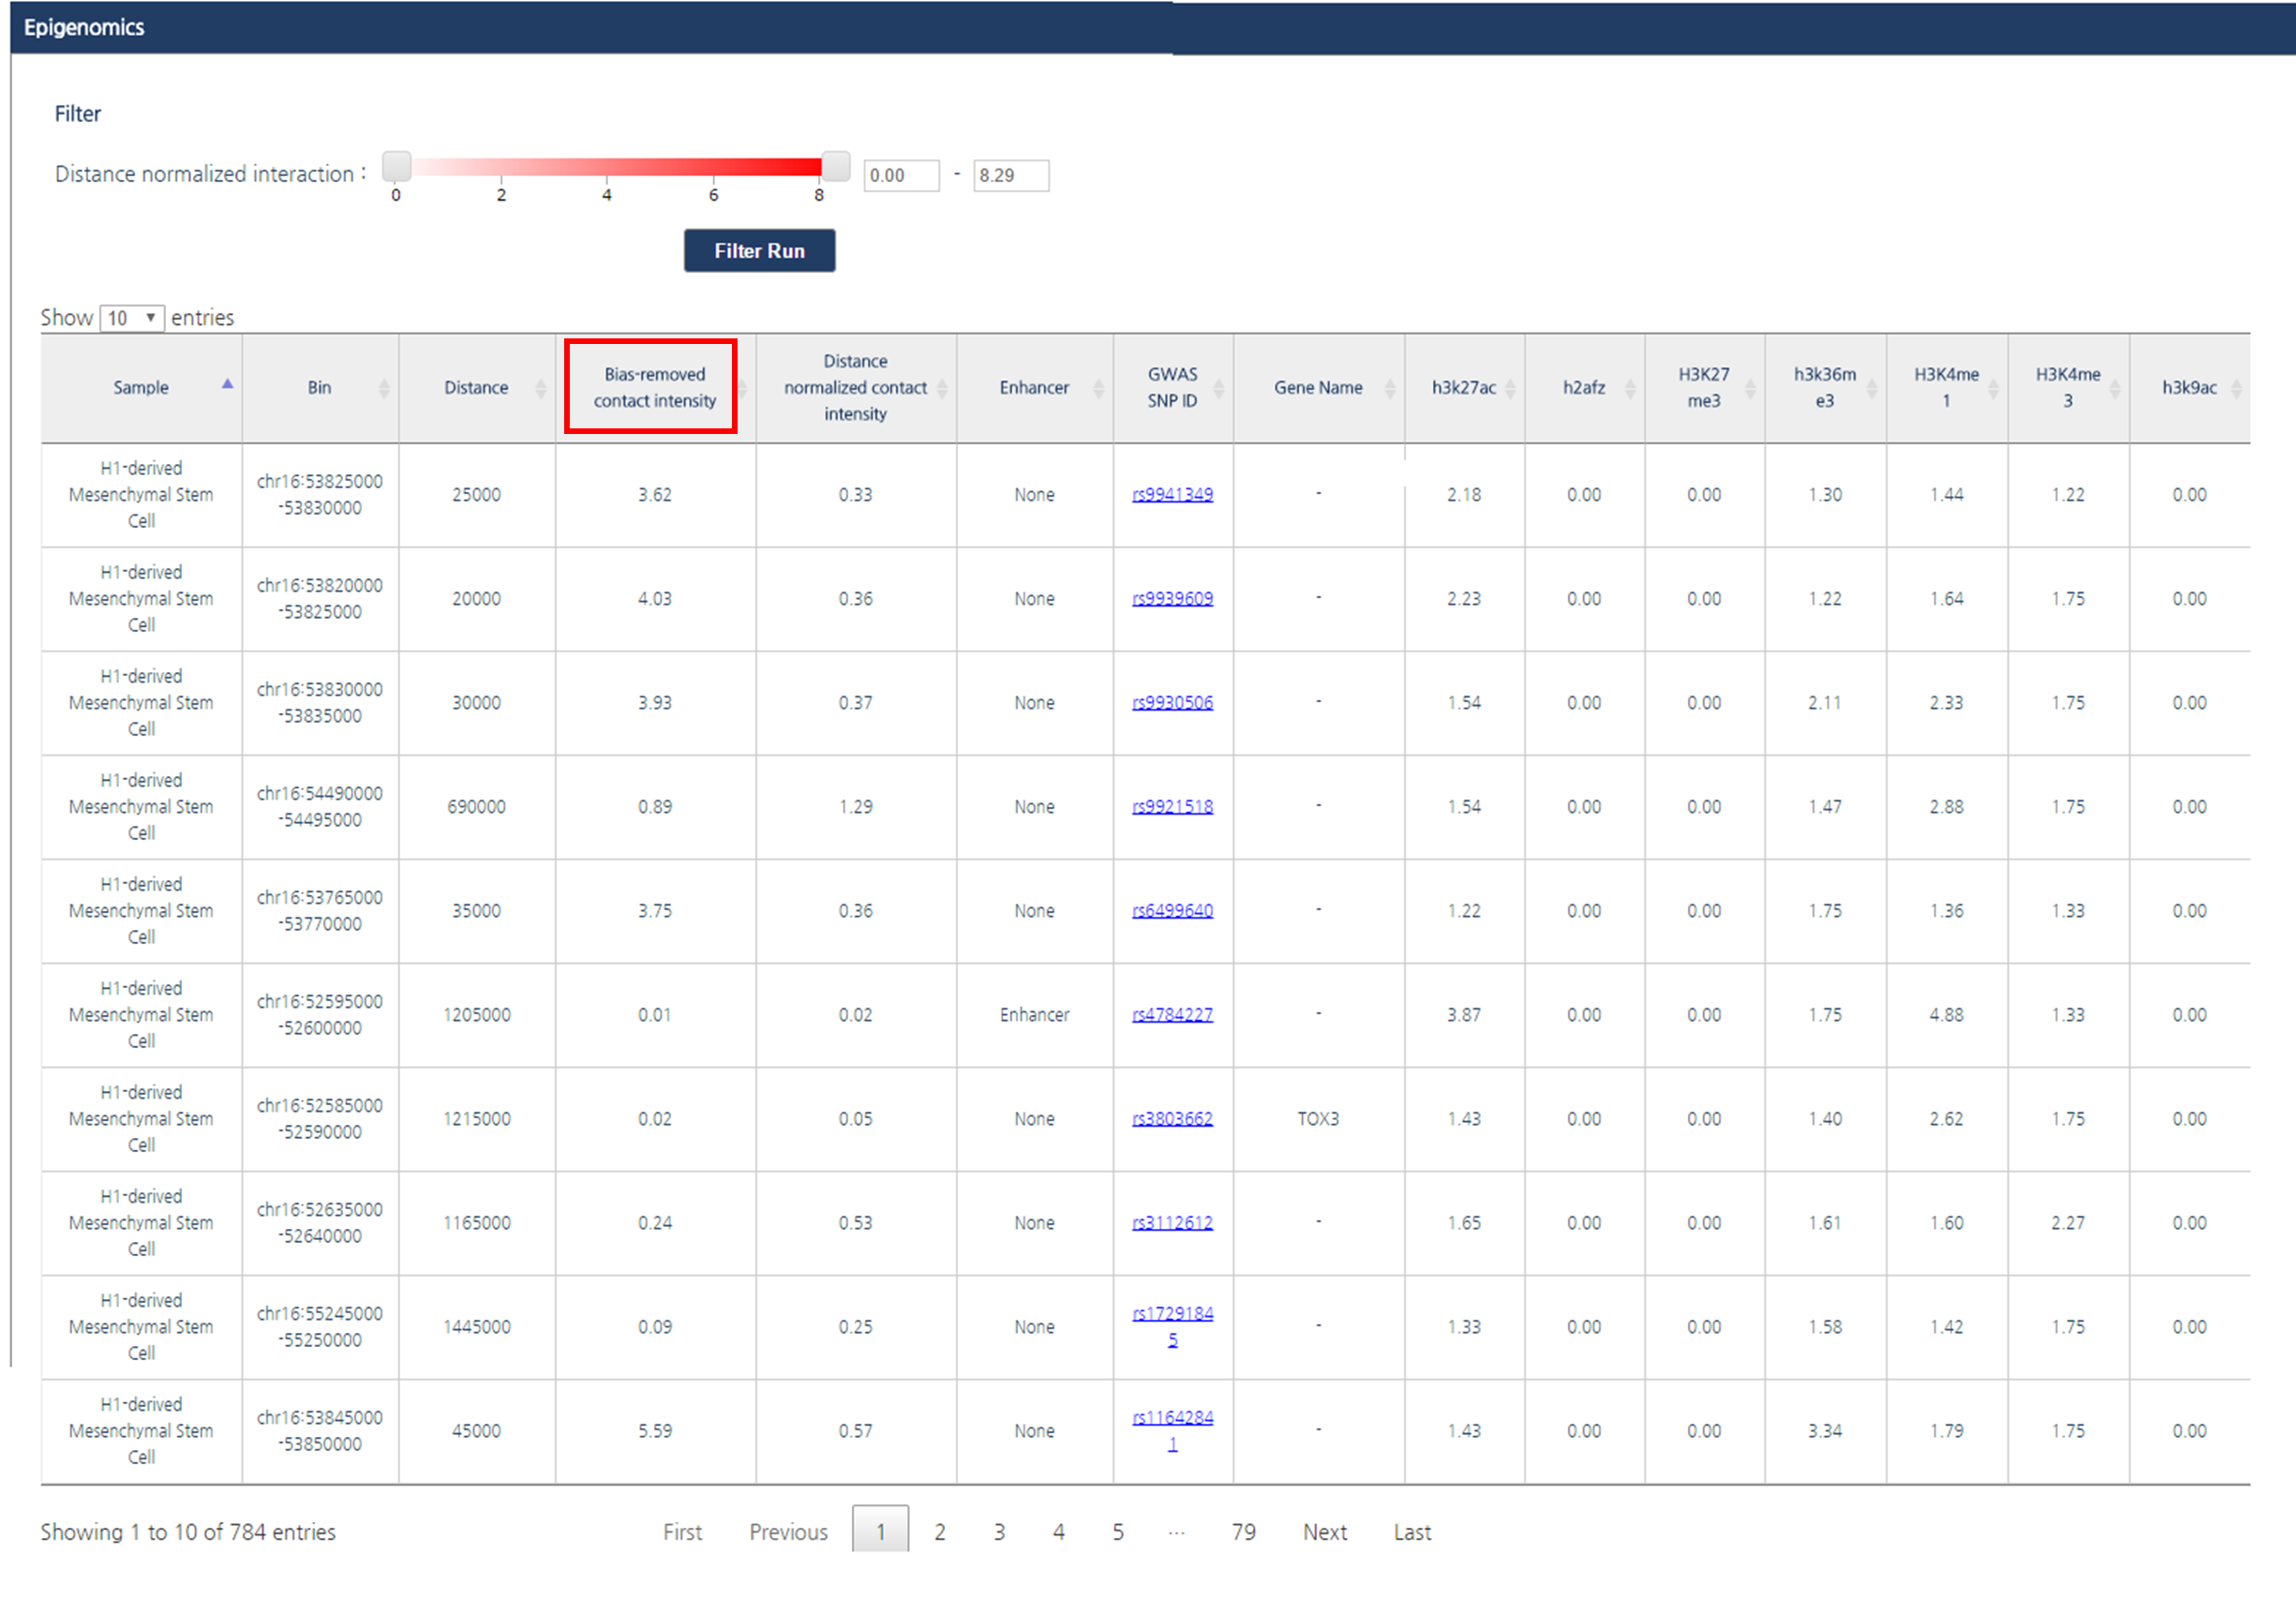
3) If you want to order interaction partners by a certain feature, click the header of the column. In this tutorial, interaction partners will be ordered by their bias-removed interaction frequency.
- Result Interpretation
These adjustments identified interactions between rs1421085 and promoters of IRX3 and IRX5.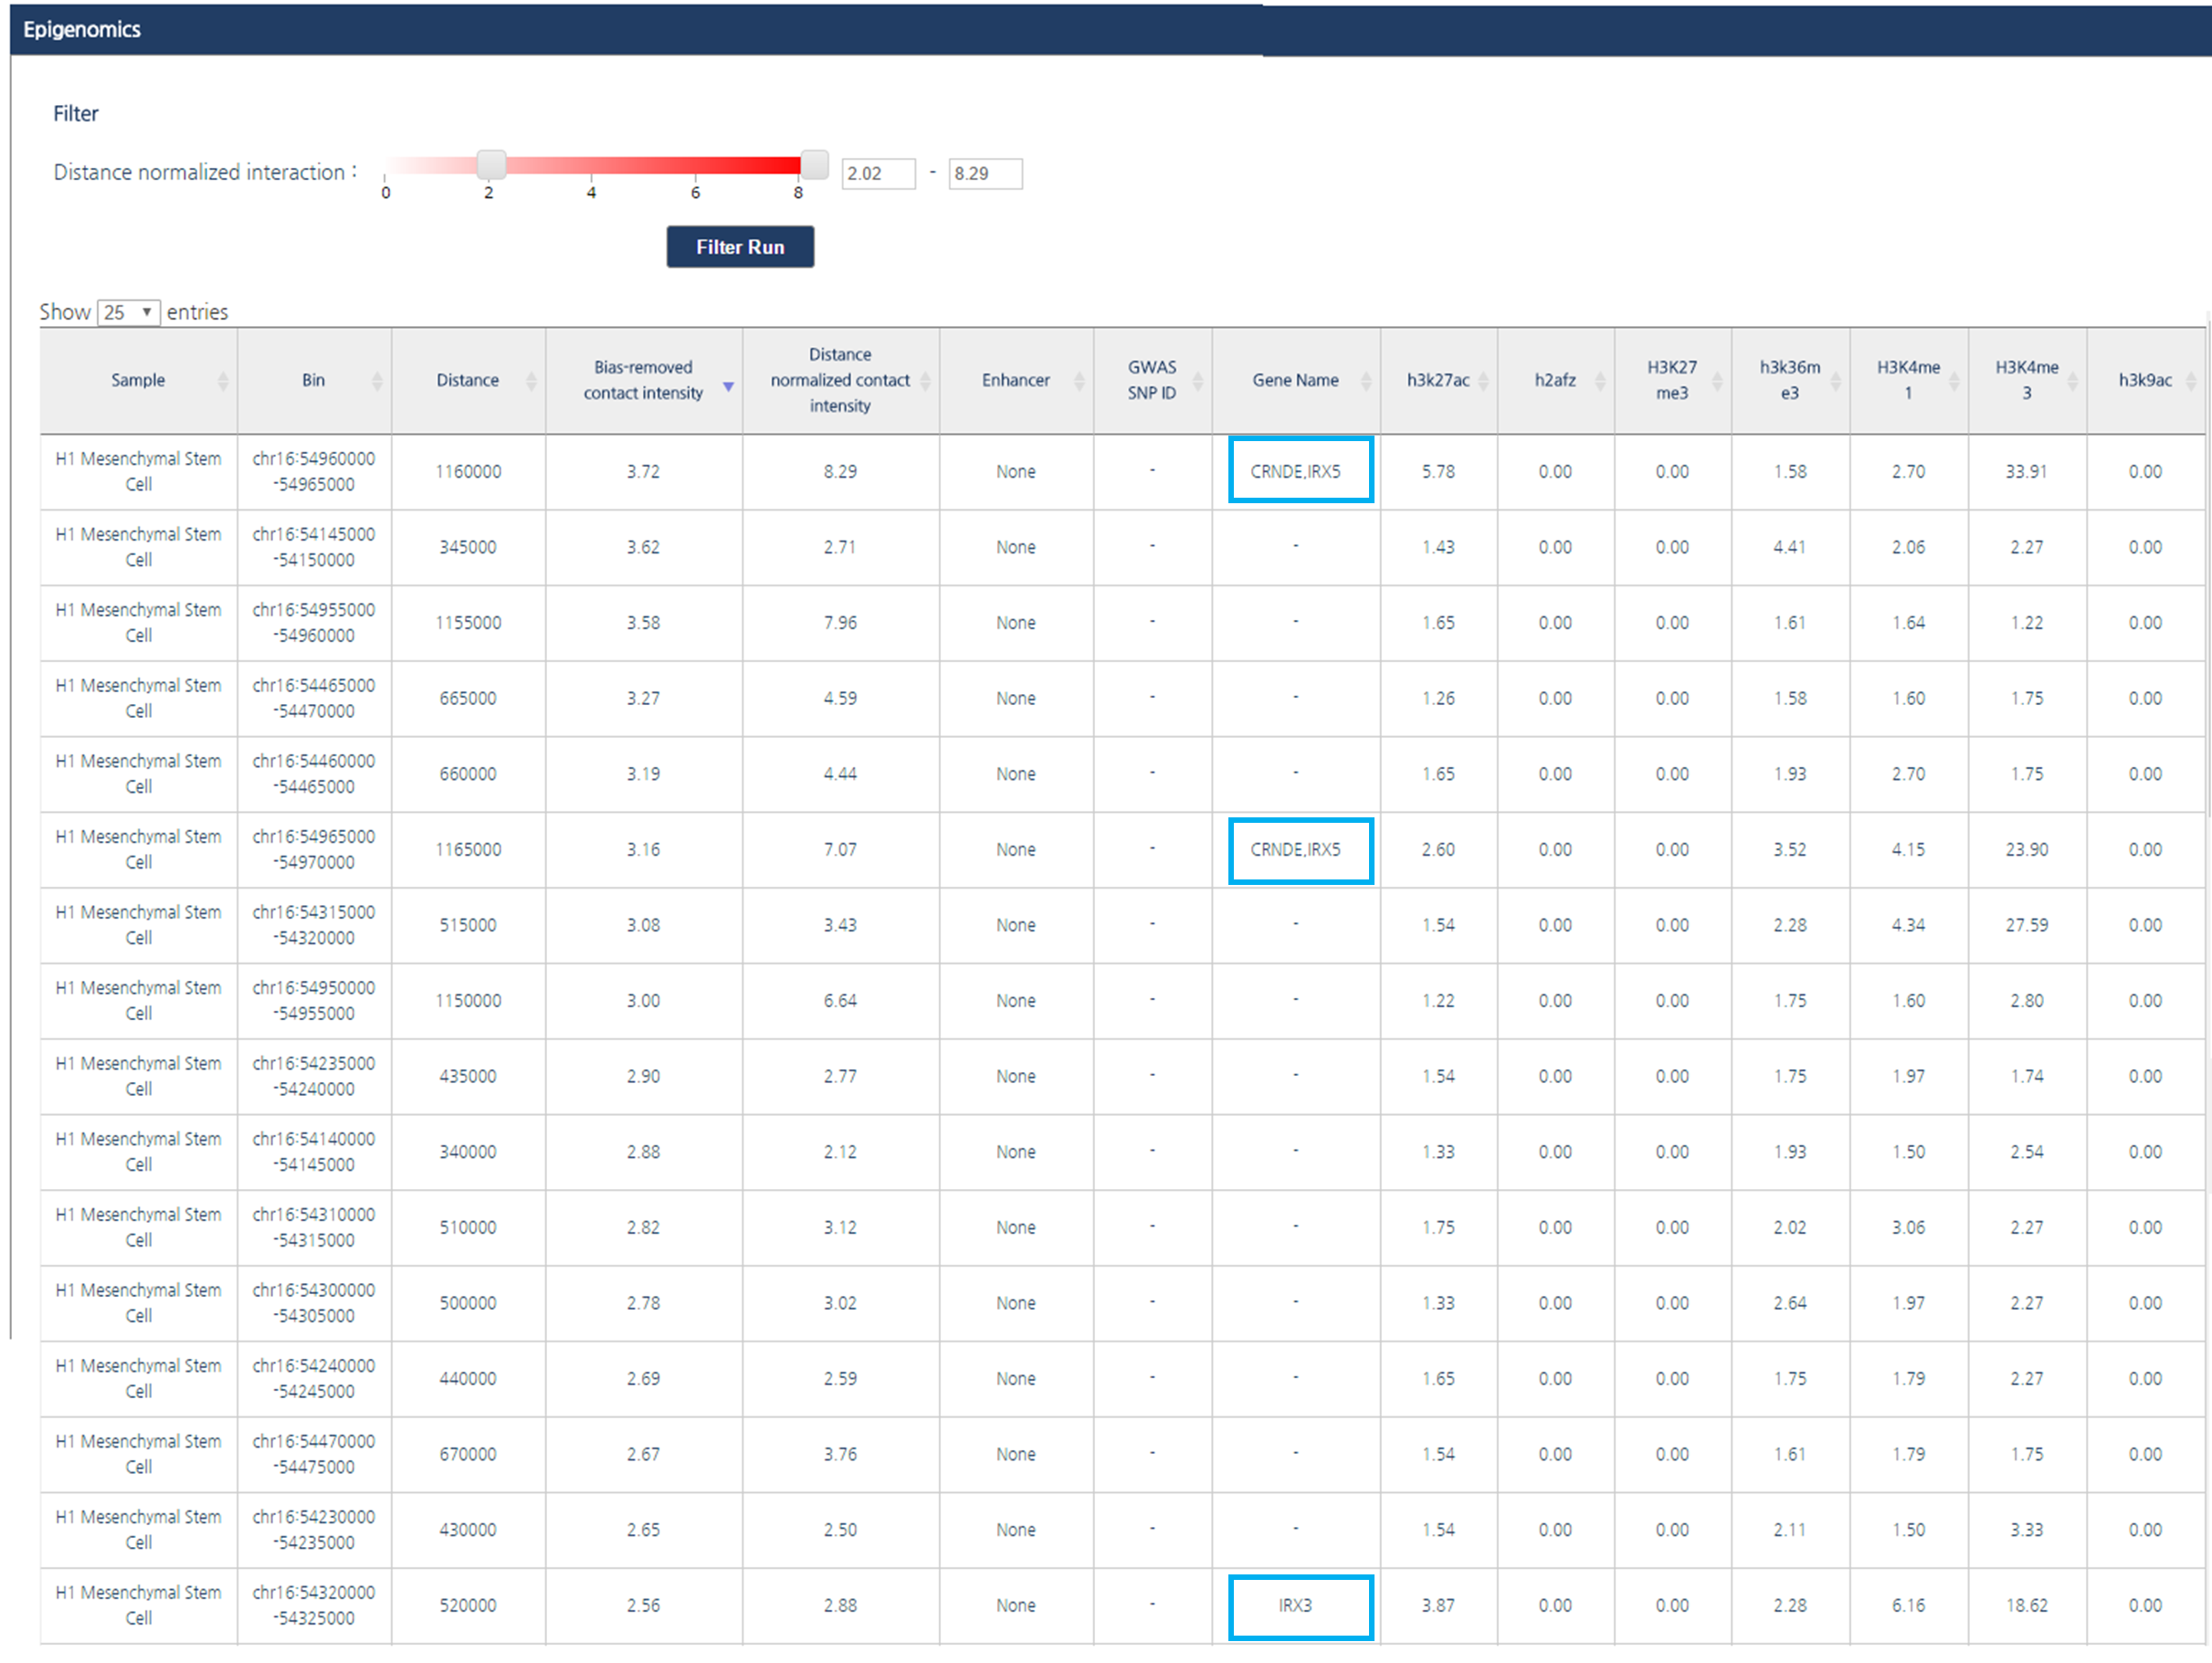
● Session 2 : Visualization of chromatin interaction
3DIV visualize the identified interactions around queried loci, which helps users to intuitively understand the interaction patterns. In this tutorial we provide an example of chr1:60,000,000 at LNCaP prostate cancer cell line and PrEC normal prostate epithelial cells. This region is well-known example of cancer-specific genome disorganization.- Input parameters
1) Click “more experiment” button to load the full list of samples.
2) Select LNCaP prostate cancer cell line and PrEC normal prostate epithelial cell by clicking the checkboxes.

3) 3DIV allows users to query gene names and SNP ID, as well as genomic coordinates. Type chr1:60000000 and click “Add Sample(s)” Button.
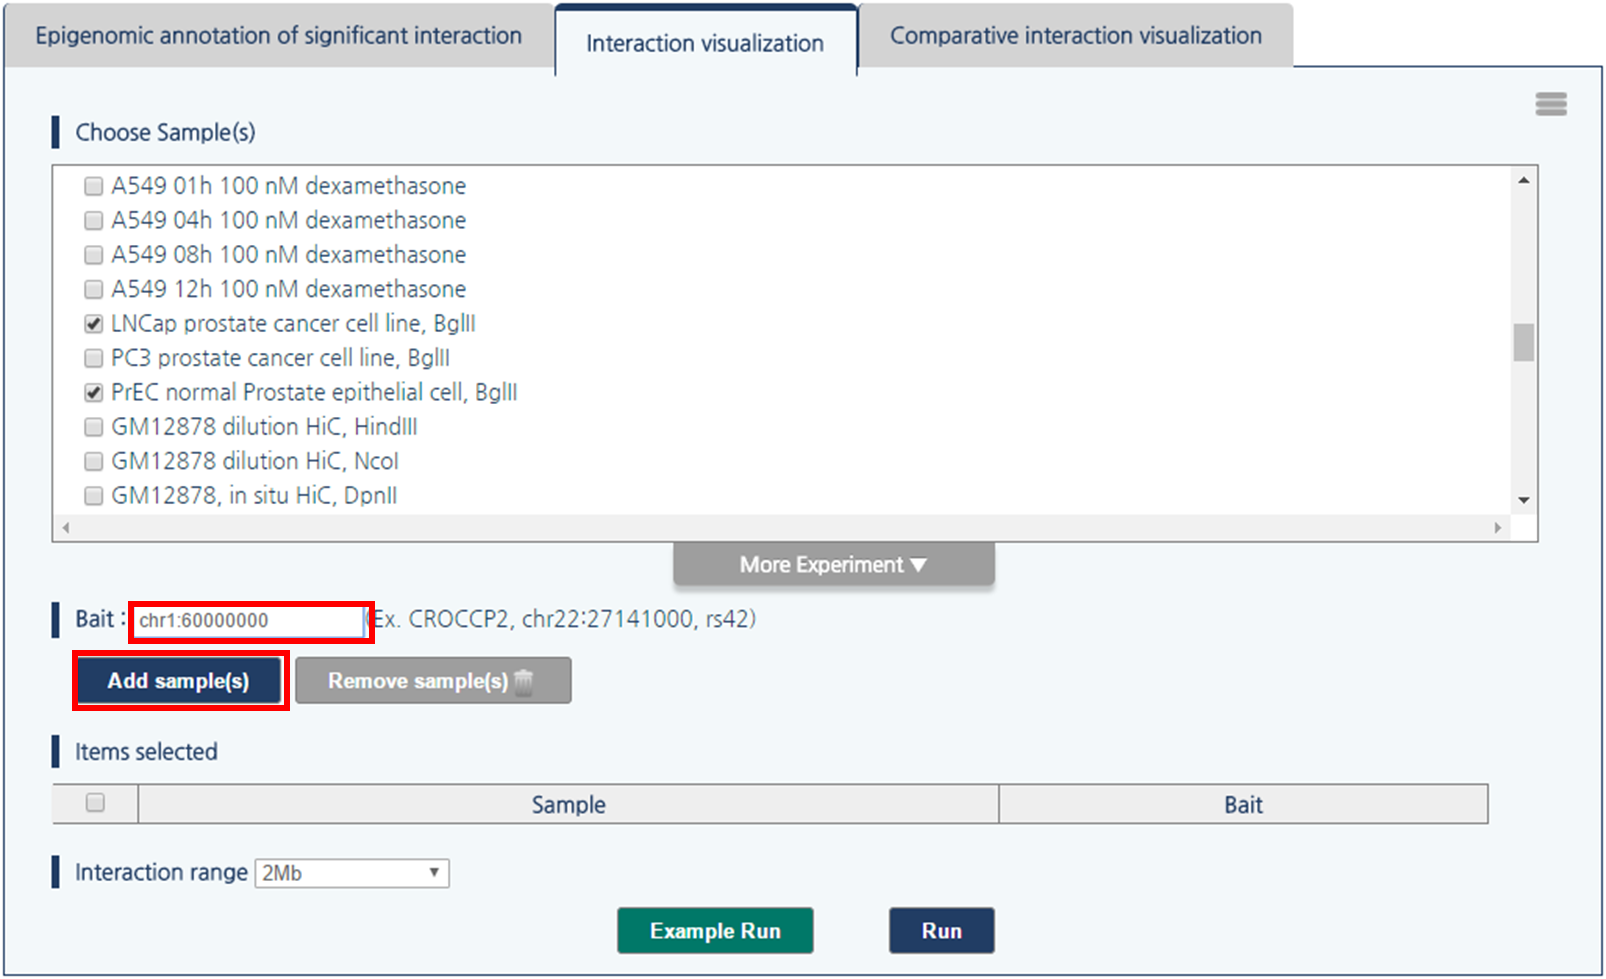
4) Then, click “Run” button to visualize chromatin interactions around queried loci.
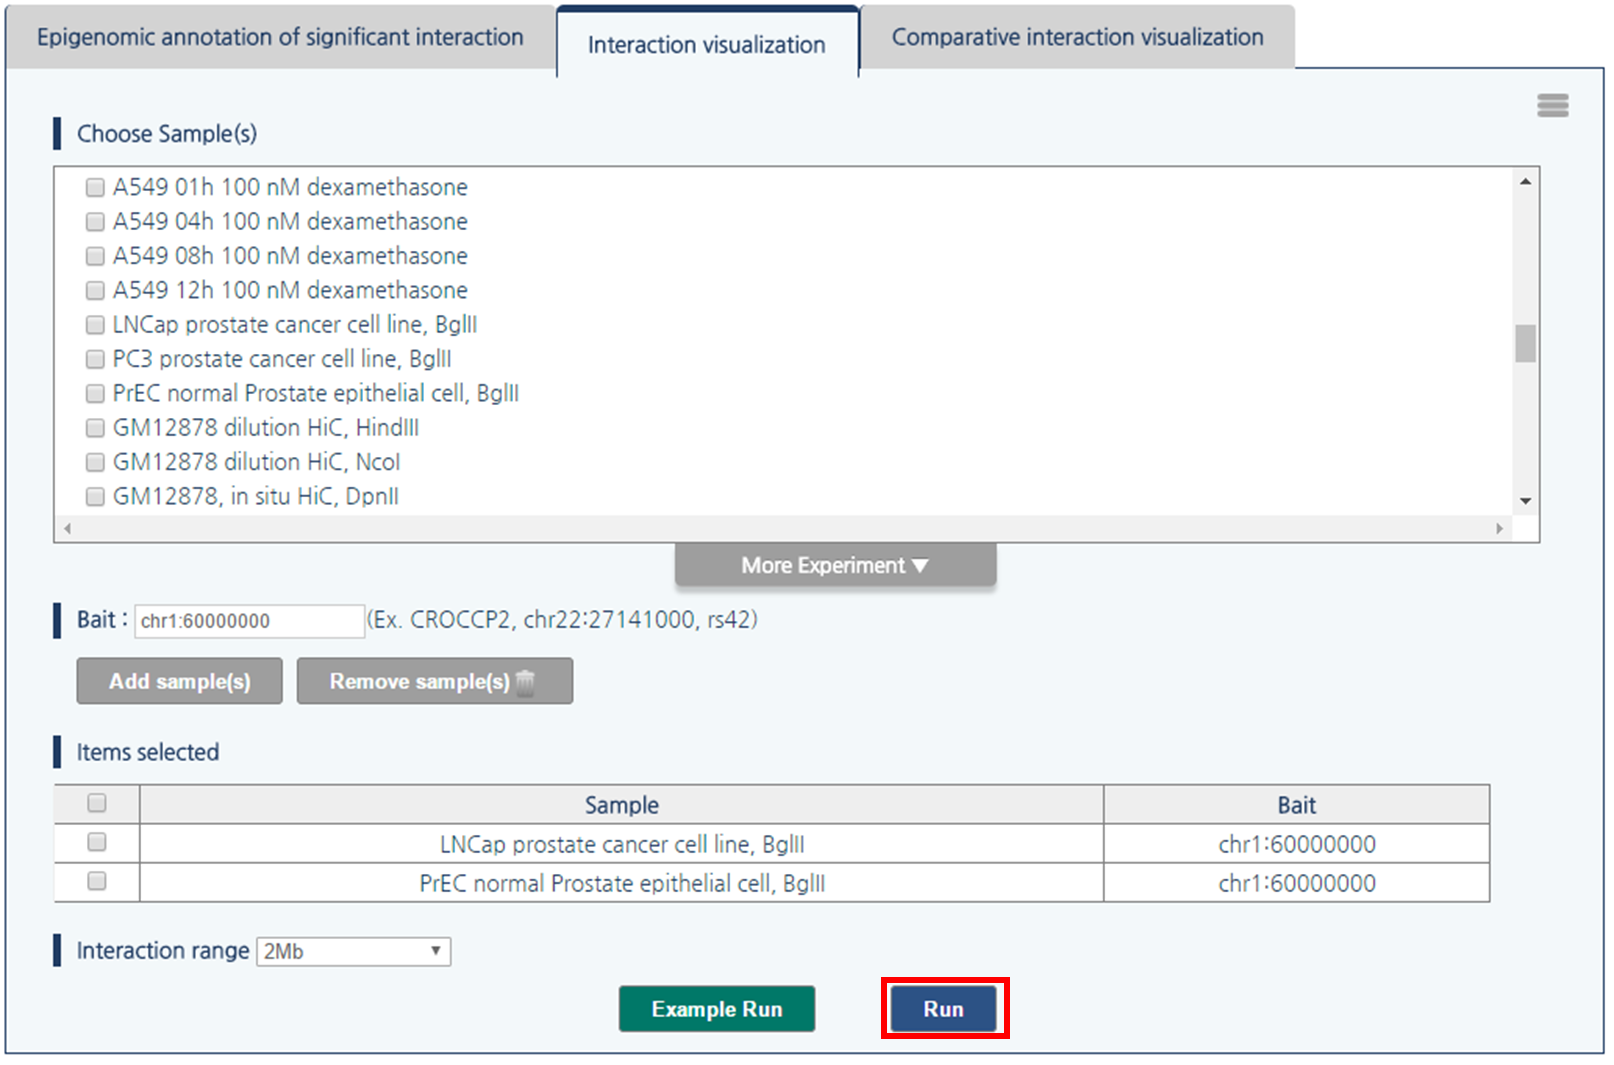
- Output
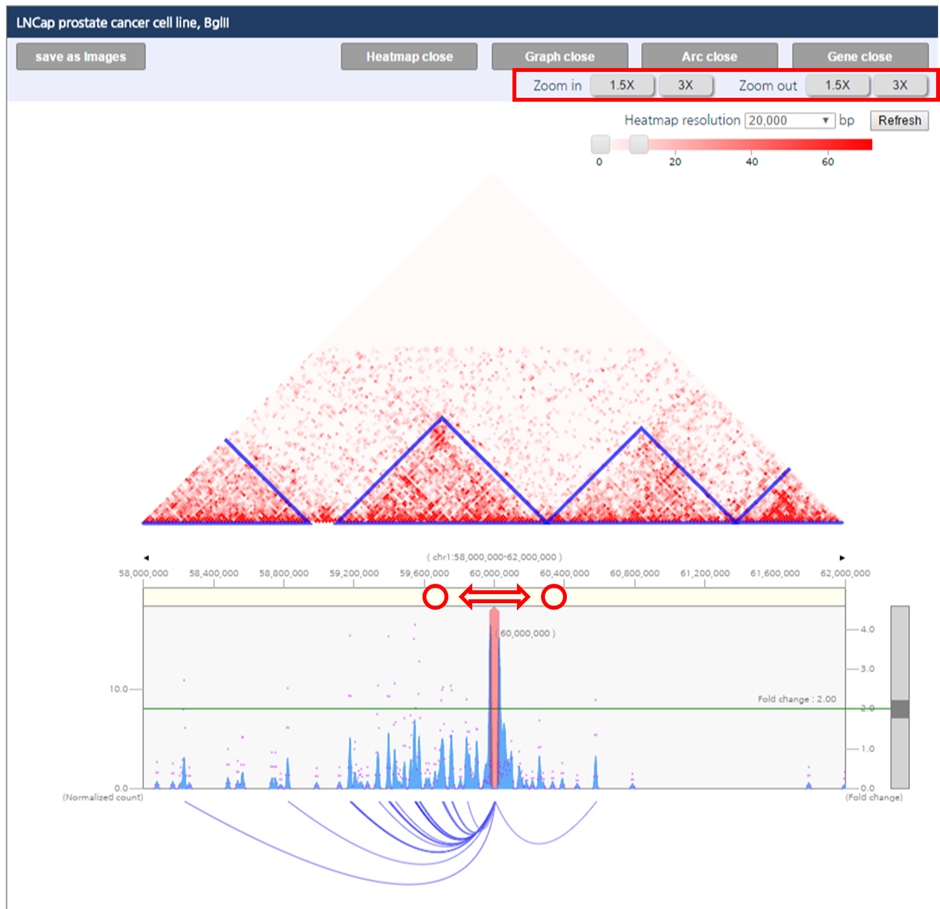
Interaction visualization result have two panels which visualize chromatin interaction of LNCaP and PrEC respectively (Ⅰ, Ⅱ). Each panel consists of five figures. First figure (a) is the interaction heat map, in which topologically associating domains (TAD), basic unit of genome 3D structure are indicated as the blue triangle. Second figure (b) is the one-to-all interaction frequency graph. Blue bar graph represents bias-removed chromatin interaction frequency, and magenta dots represent distance-normalized interaction frequency. Third figure (c) is the arc-diagram of the identified interactions, which are defined by the threshold displayed as the green line in figure (b). Fourth figure (d) annotates super-enhancers and RefSeq Genes. Last figure (e) describes an interaction partner of the queried loci upon clicking an interaction of interested shown in figure (c).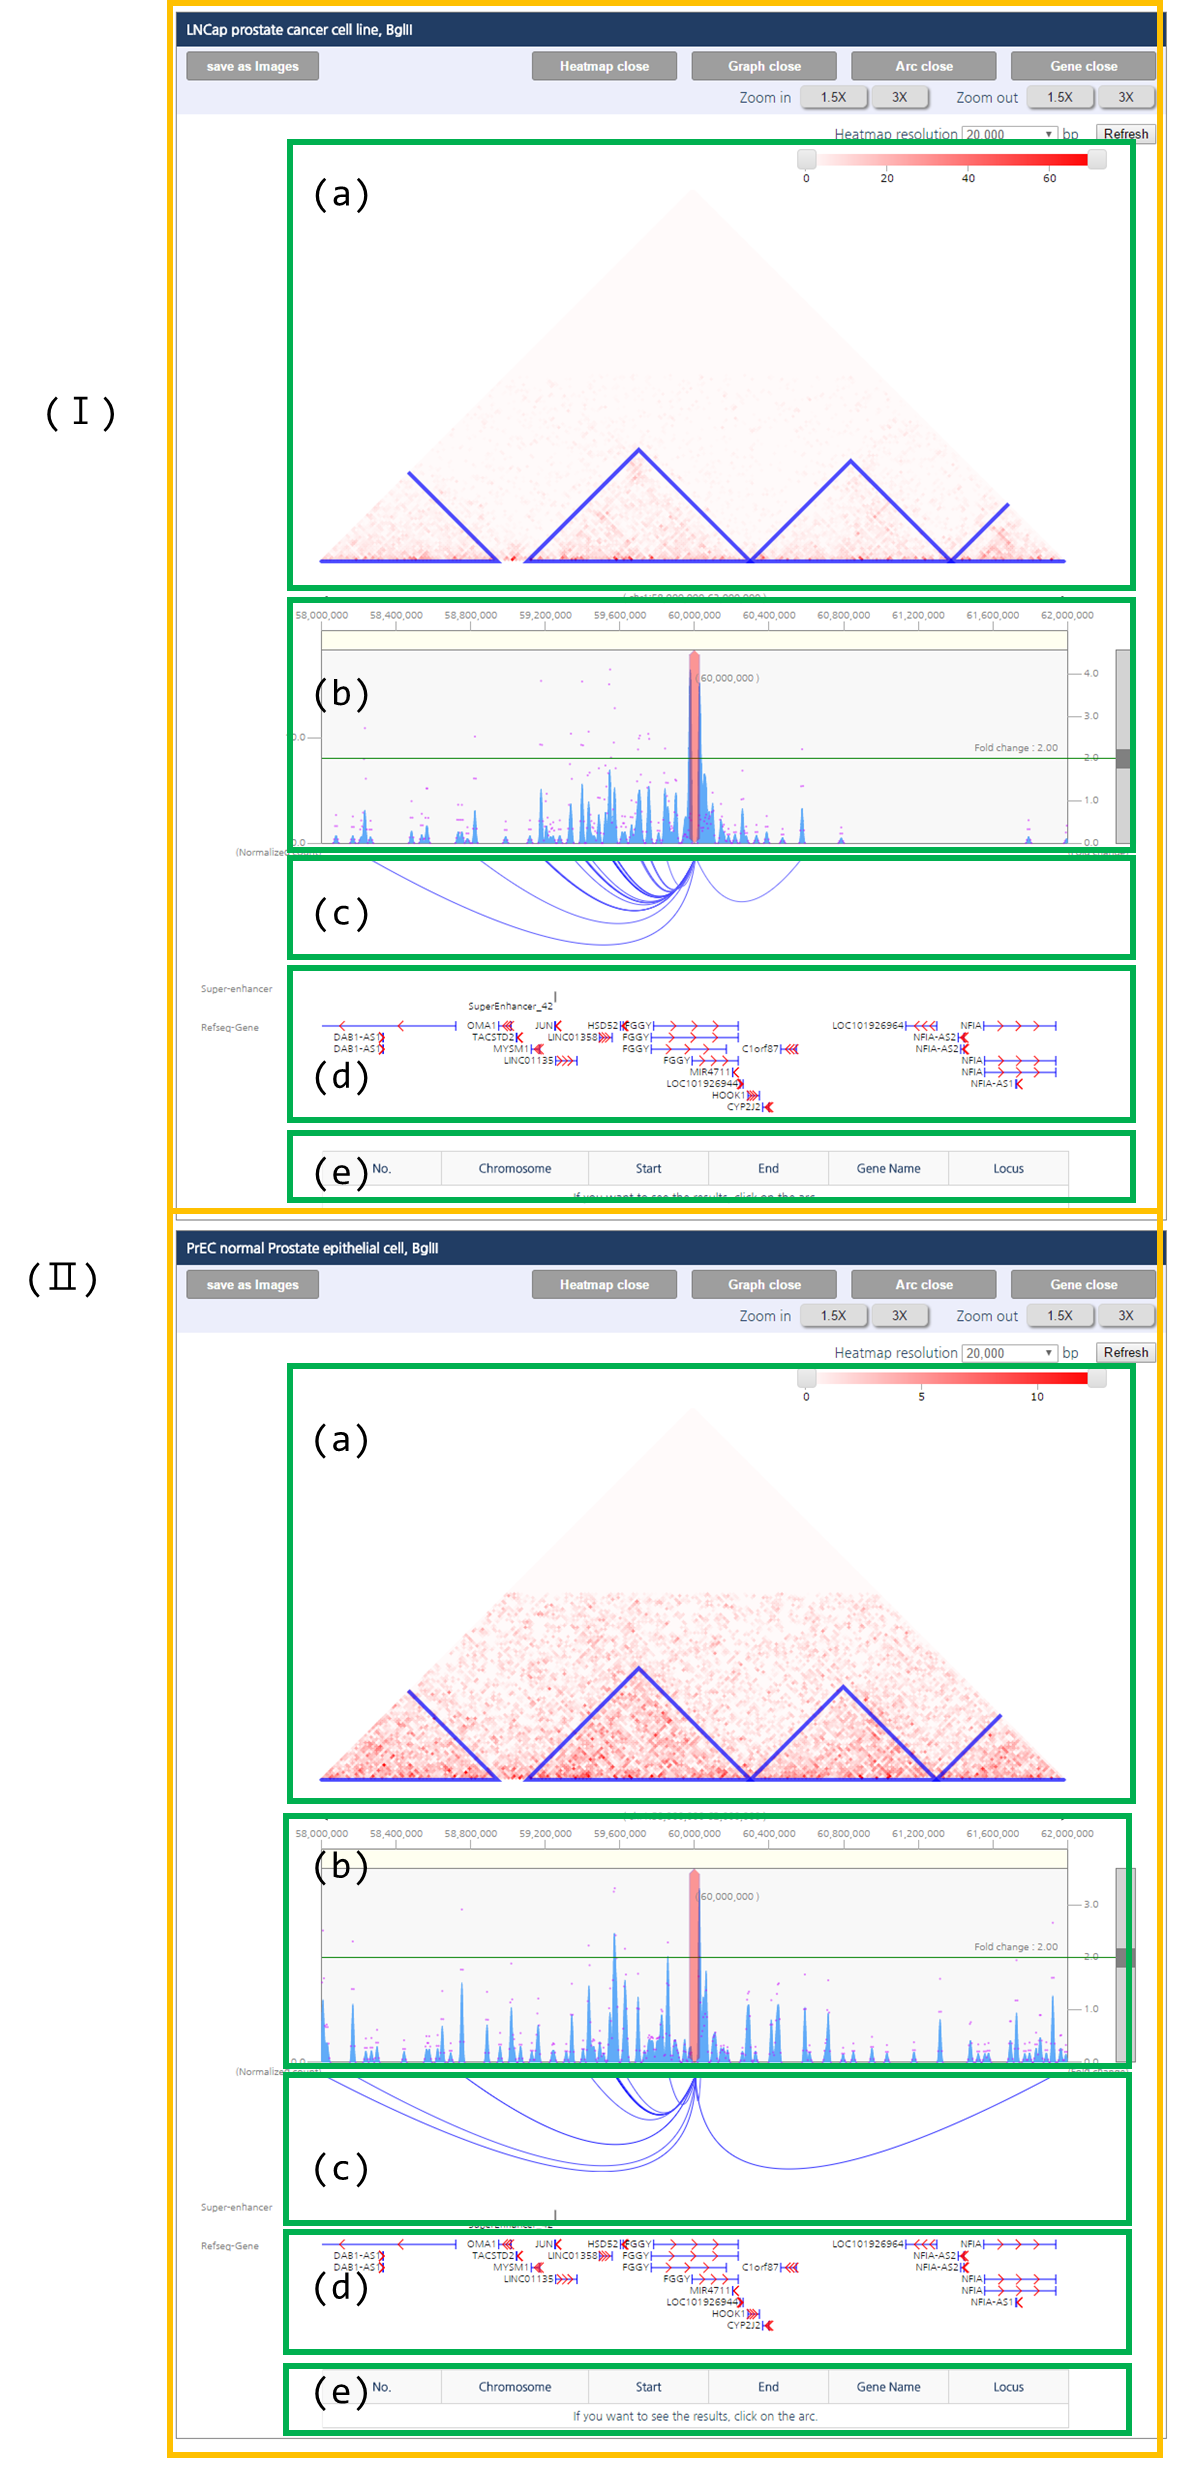
- Result Adjustment
1) To adjust the color range of heat map, drag the scroll bar for color range above the heatmap.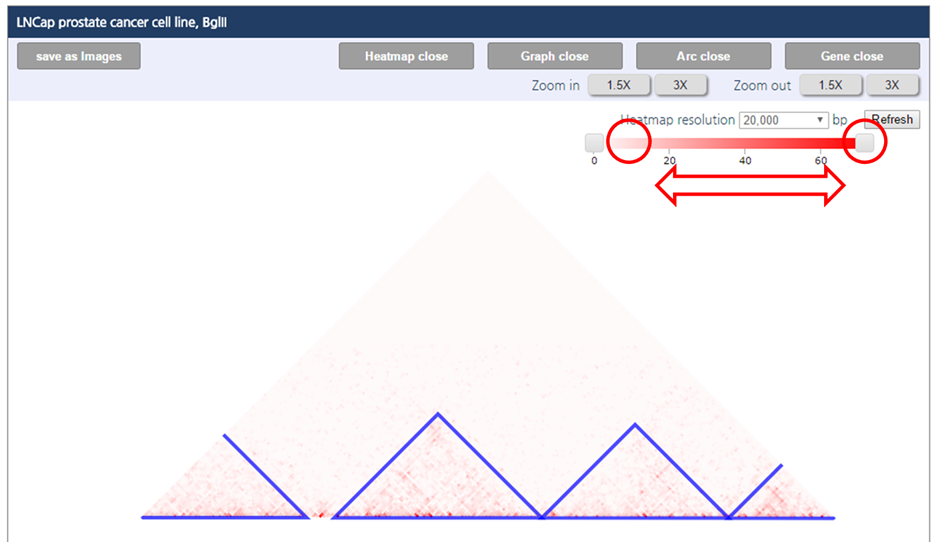
2) To shift visualization range without changing the queried loci, click on white space of the graph and drag horizontally towards the desired direction.
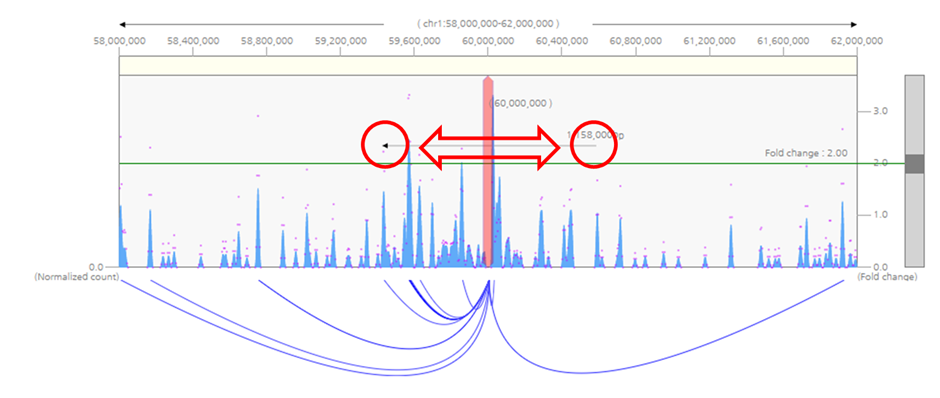
3) To select other loci as the query, click the red bait indicator and drag to the loci of interest.
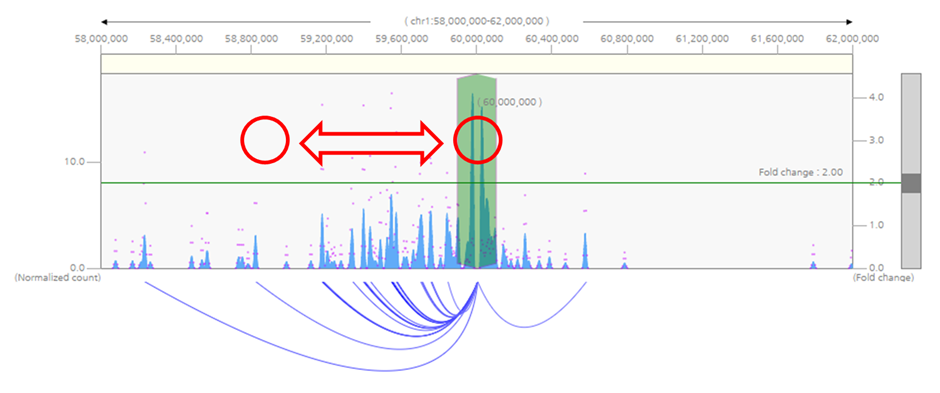
4) To zoom-in or zoom-out visualization range, either click zoom-in/zoom-out button above the heatmap, or select the visualization range by dragging the yellow area at the top of the graph.
5) By Dragging the scroll bar at the right site of interaction frequency graph, you can change significance criteria for the interactions.

6) User can hide and show any subfigures by clicking “heatmap open/open”, “Graph open/close”, “arc open/close”, or “Gene open/close” button. Each button show and hide interaction frequency heat map, one-to-all interaction frequency graph, arc-representation of identified interactions, and annotations of gene body and super-enhancer respectively.

● Session 3 : Comparative visualization of chromatin interaction
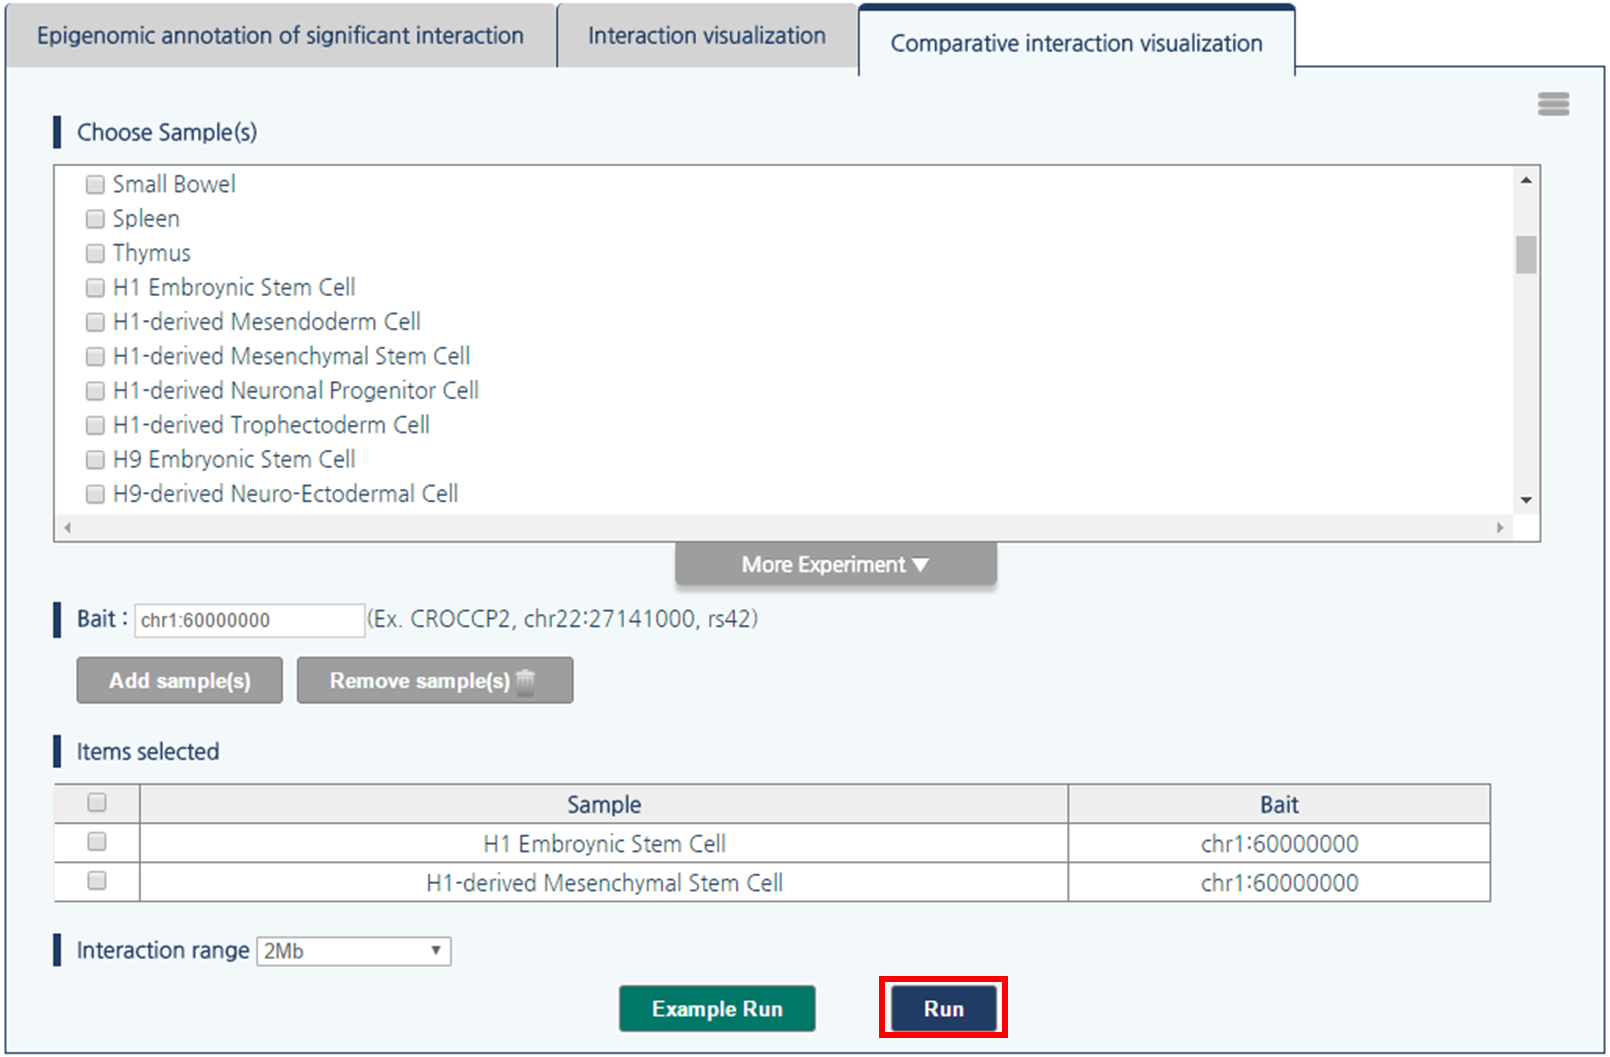
3DIV also enables us to perform comparative analysis of gain or loss of interactions between too samples by generating a comparative heatmap with automatic scale synchronization. In this tutorial, we provide an example of chr1:60,000,000 at H1 embryonic stemcell and H1-derived mesenchymal stem cell (MSC). This region is well-known example of TAD-wise loss or gain of interaction during differentiation.- Input parameters
1) First, choose a pair of samples by clicking the checkboxes. Click “more experiment” button to load the full list of samples.
2) Select H1 embryonic stem cell and H1-derived Mesenchymal Stem Cell by clicking checkboxes.

3) 3DIV allows users to query gene names and SNP ID, as well as genomic coordinates. Type chr1:60000000 and click “Add Sample(s)” Button.
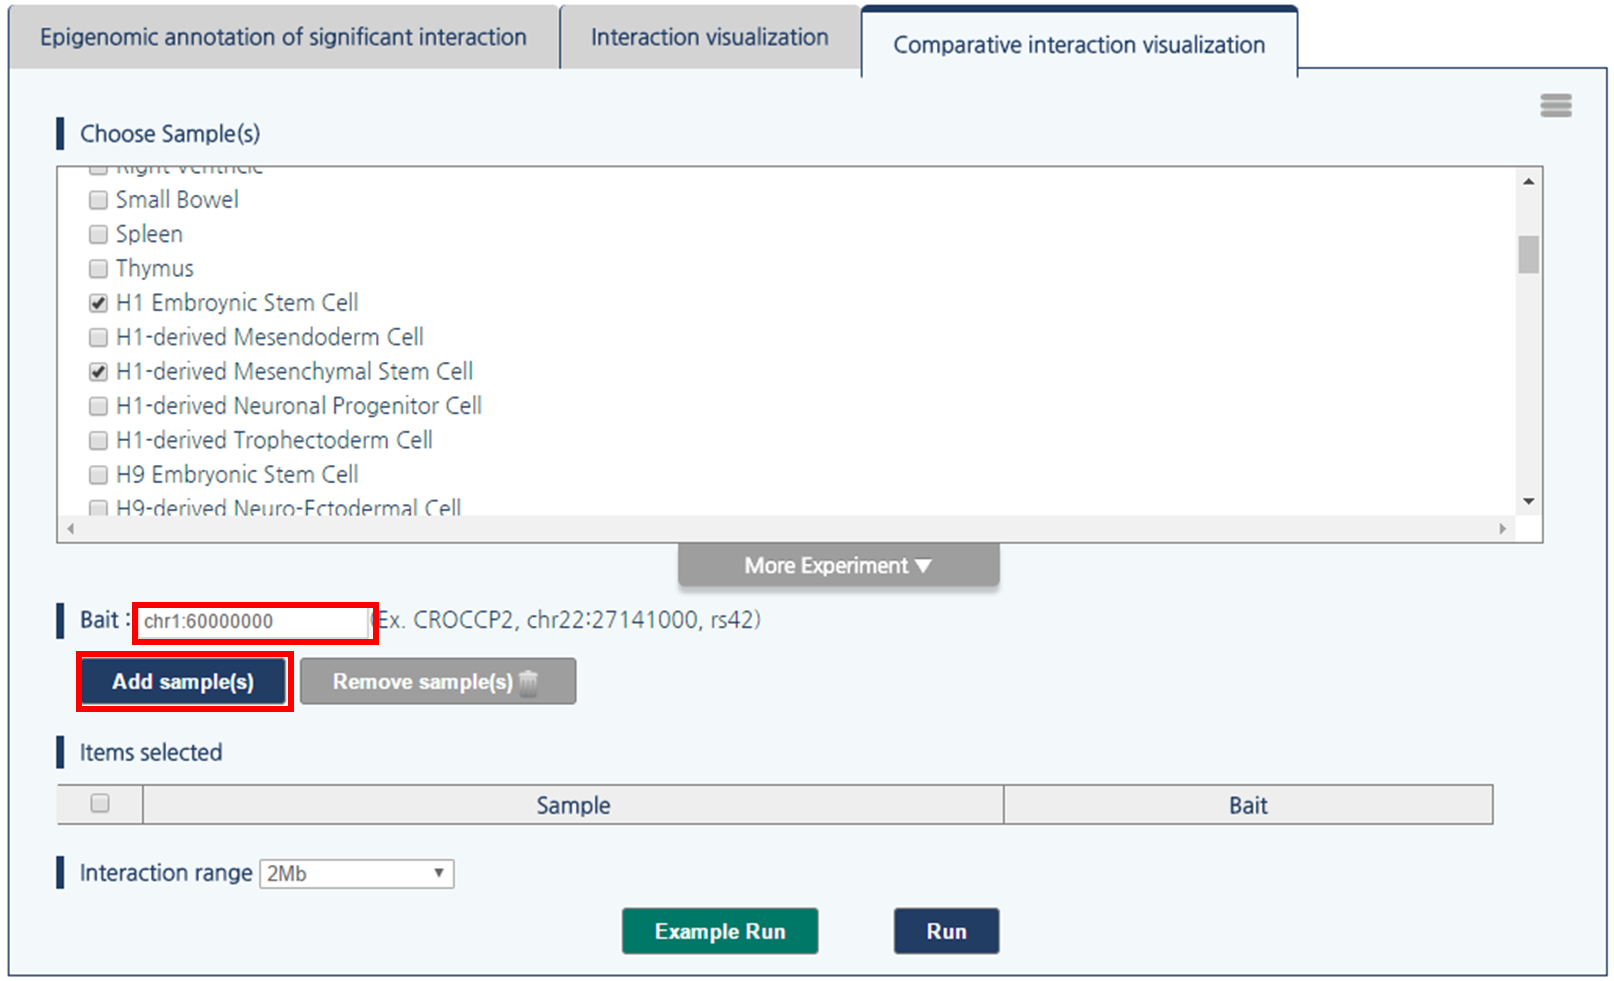
4) Then, click “run” button to compare the chromatin interactions near the queried loci.
- Output
The comparative interaction visualization result consists of five figures. First figure (a) is the comparative interaction heat map. Second figure (b) is the one-to-all chromatin interactions for a given query with a synchronized scale. Blue bar graph represents bias-removed chromatin interaction frequency, and magenta dots represent distance-normalized interaction frequency. Third figure (c) is the arc-diagram of identified interactions, which are defined by the threshold displayed as the green line in figure (b). Fourth figure (d) annotates super-enhancers and RefSeq Genes. Last figure (e) explains an interaction partner of the queried loci upon clicking an interaction arc of interest in figure (c).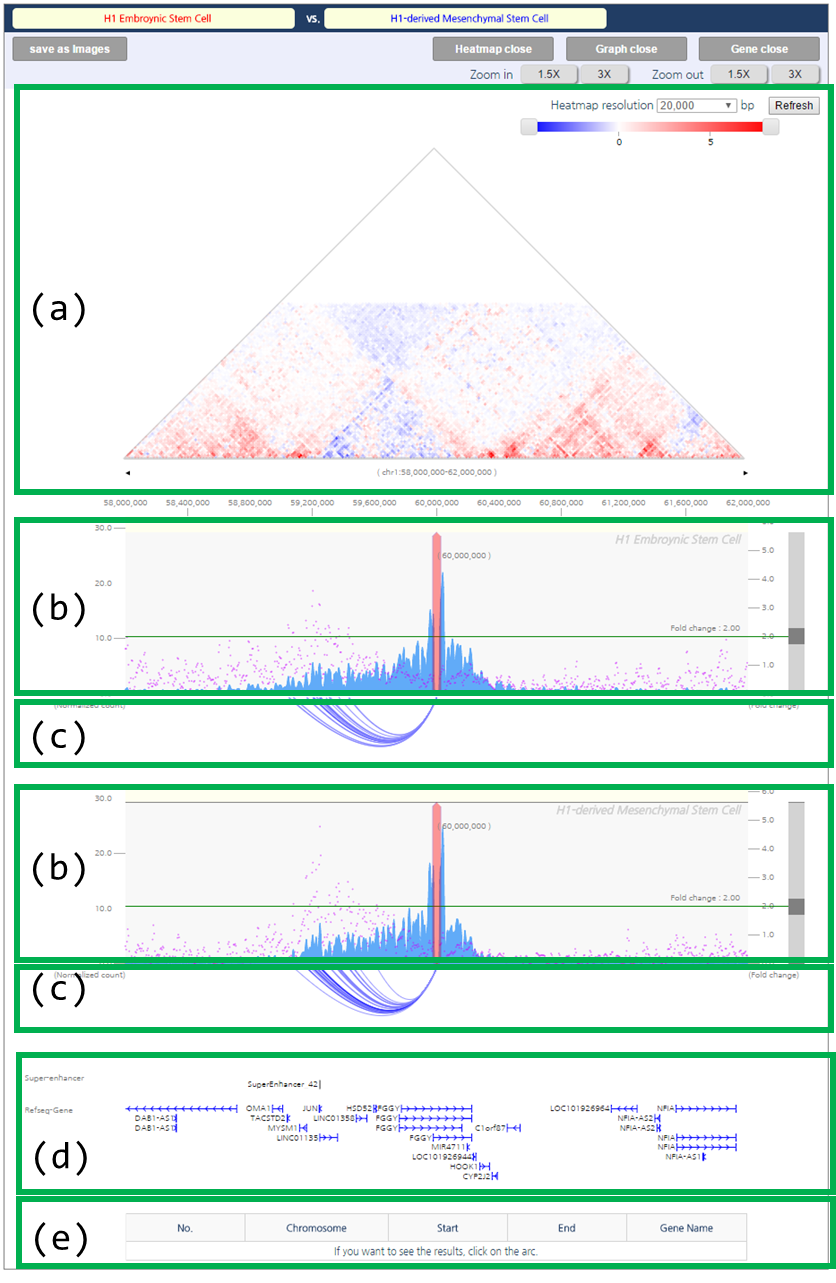
- Result Adjustment
1) To adjust the color range of heat map, drag the scroll bar for color range above the heatmap.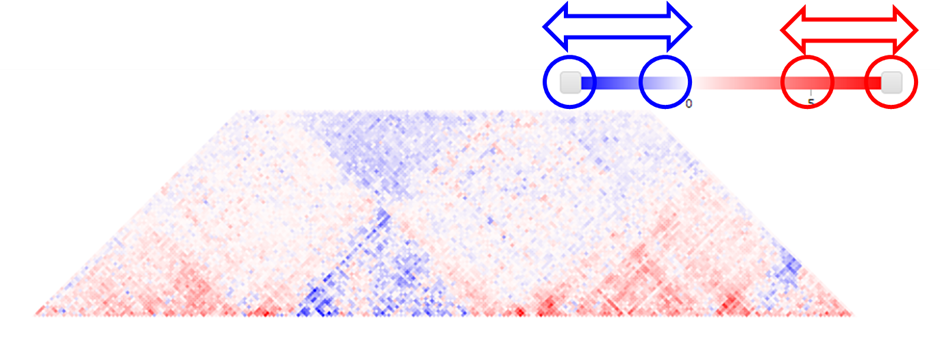
- Result Interpretation
The comparative interaction heatmap reflects loss or gain of interactions between samples. The blue color indicates higher interaction frequencies in mesenchymal stem cell specific. In line with the heatmap, the arc-diagram of identified interactions also presents additional number of long-range chromatin interactions in MSC.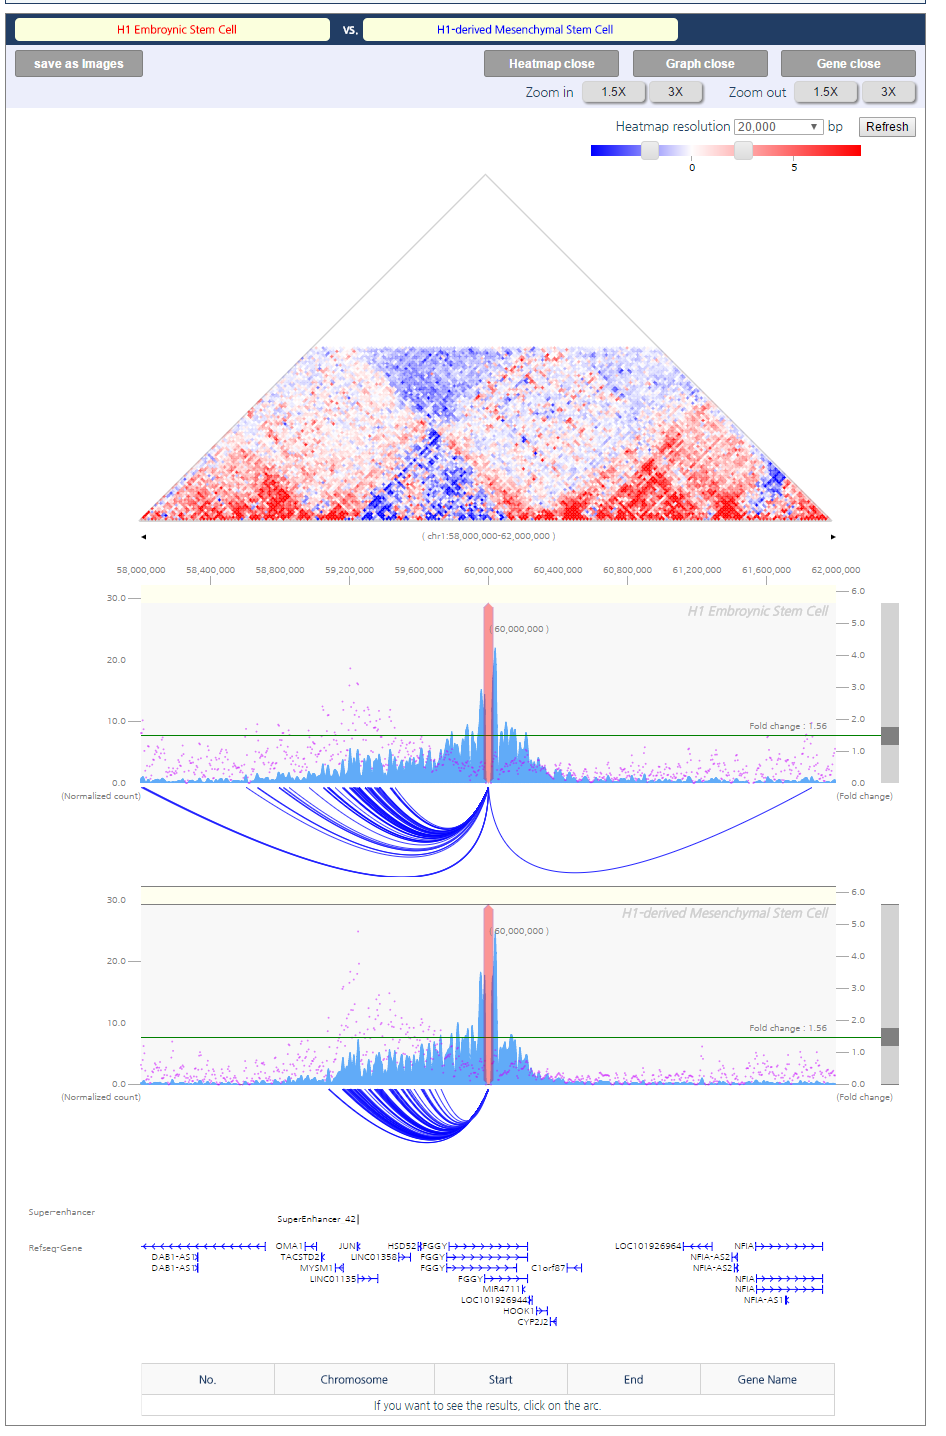
● Session Save/Load and Visualization Export
3DIV allows users to save and load the result, which do not require any login or registration. 3DIV makes session file which describe samples and queried locus in JSON format. User can reproduce analysis result from other computer, or share the result with collaborator by transferring the session file. Moreover, 3DIV exports figures in SVG format, which can be imported by other drawing software for building publish-ready scientific figures.- Save session as a file
1) When user performed the analysis, click menu button, which is located at upper-right side of the panel.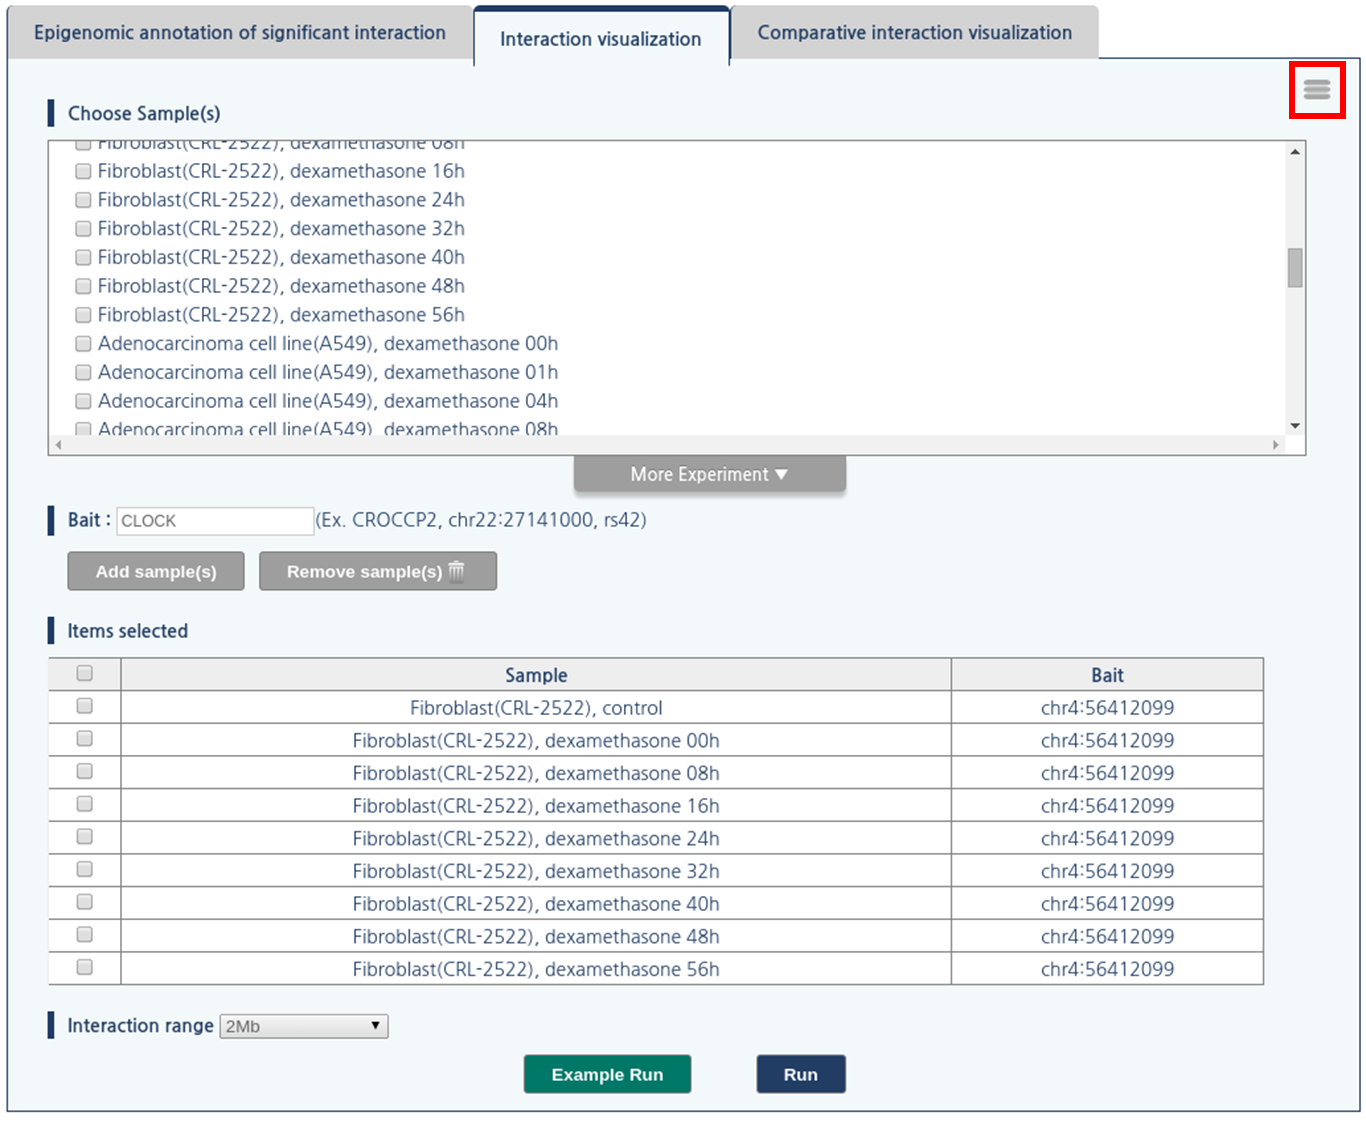
2) Then, click save setting button. 3DIV generate the session file, and web browser will download the session file.

- Load session from a file
1) Click menu button, which is located at upper-right side of the panel.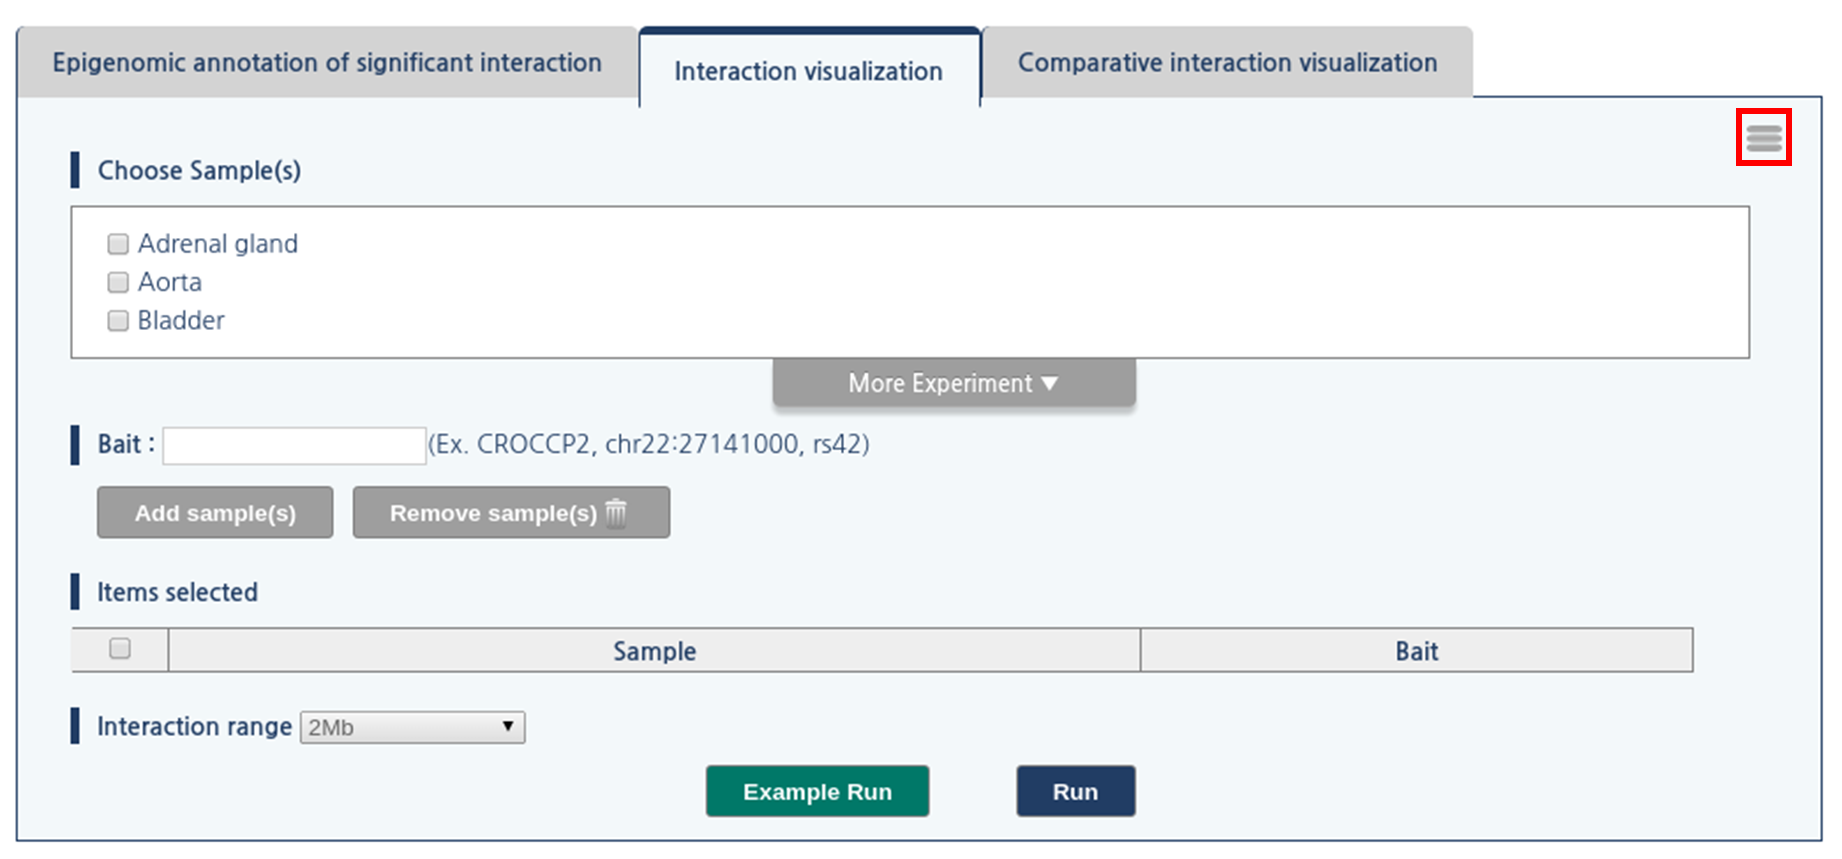
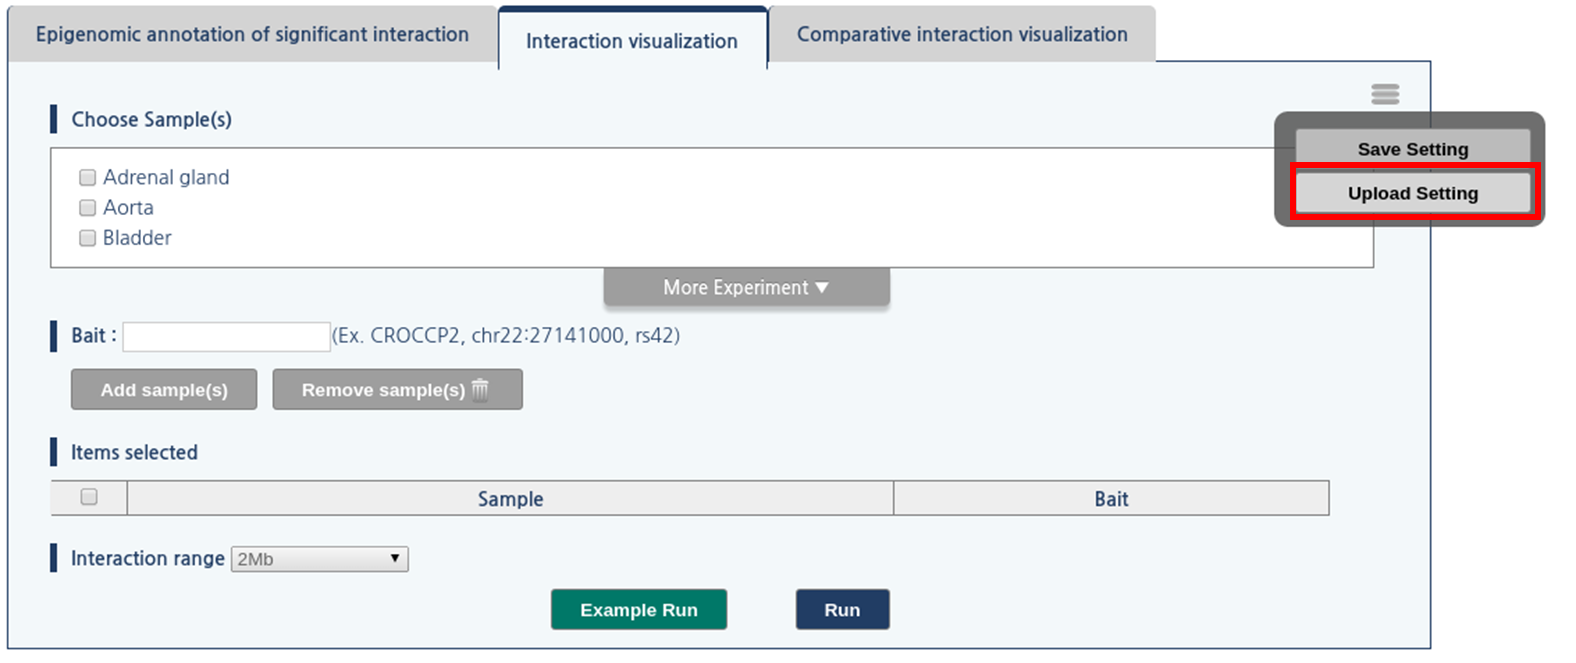
2) Then, click “upload setting” button
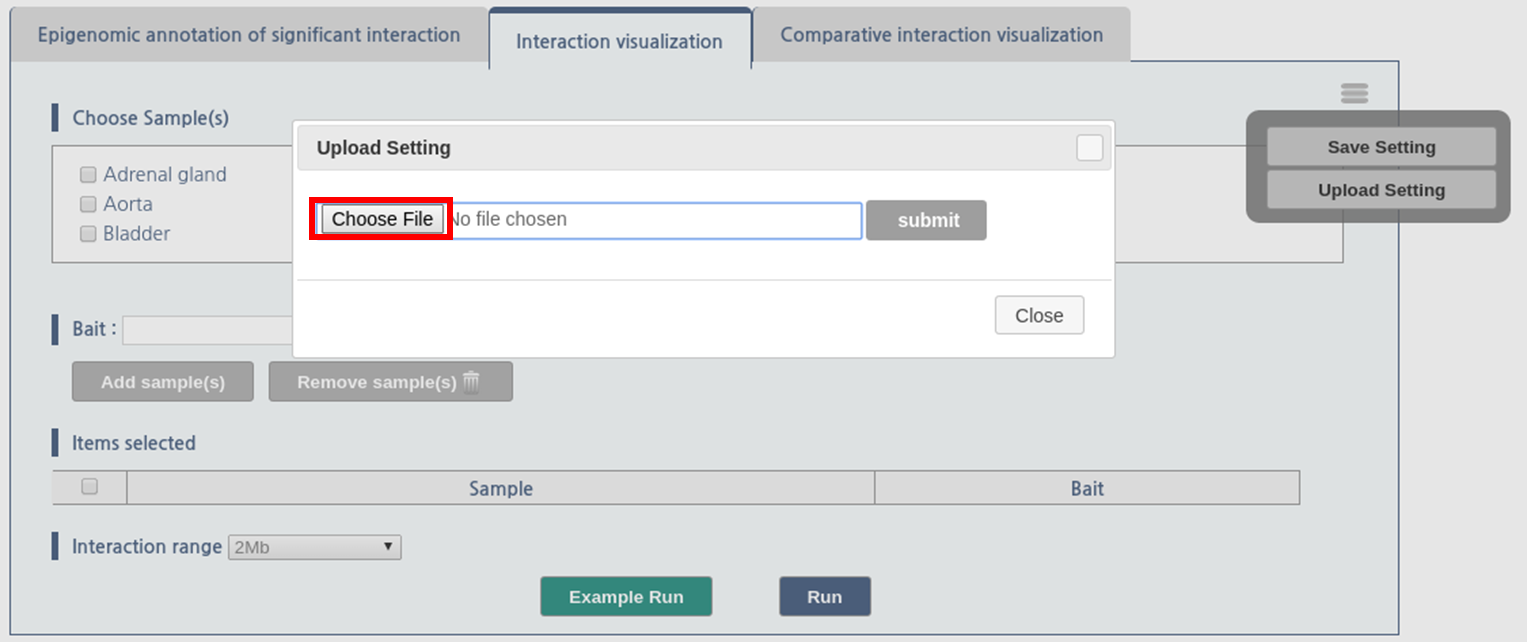
3) The dialogue box askes the location of file. Click “choose file” button and assign the location of the session file.
- Export Figures
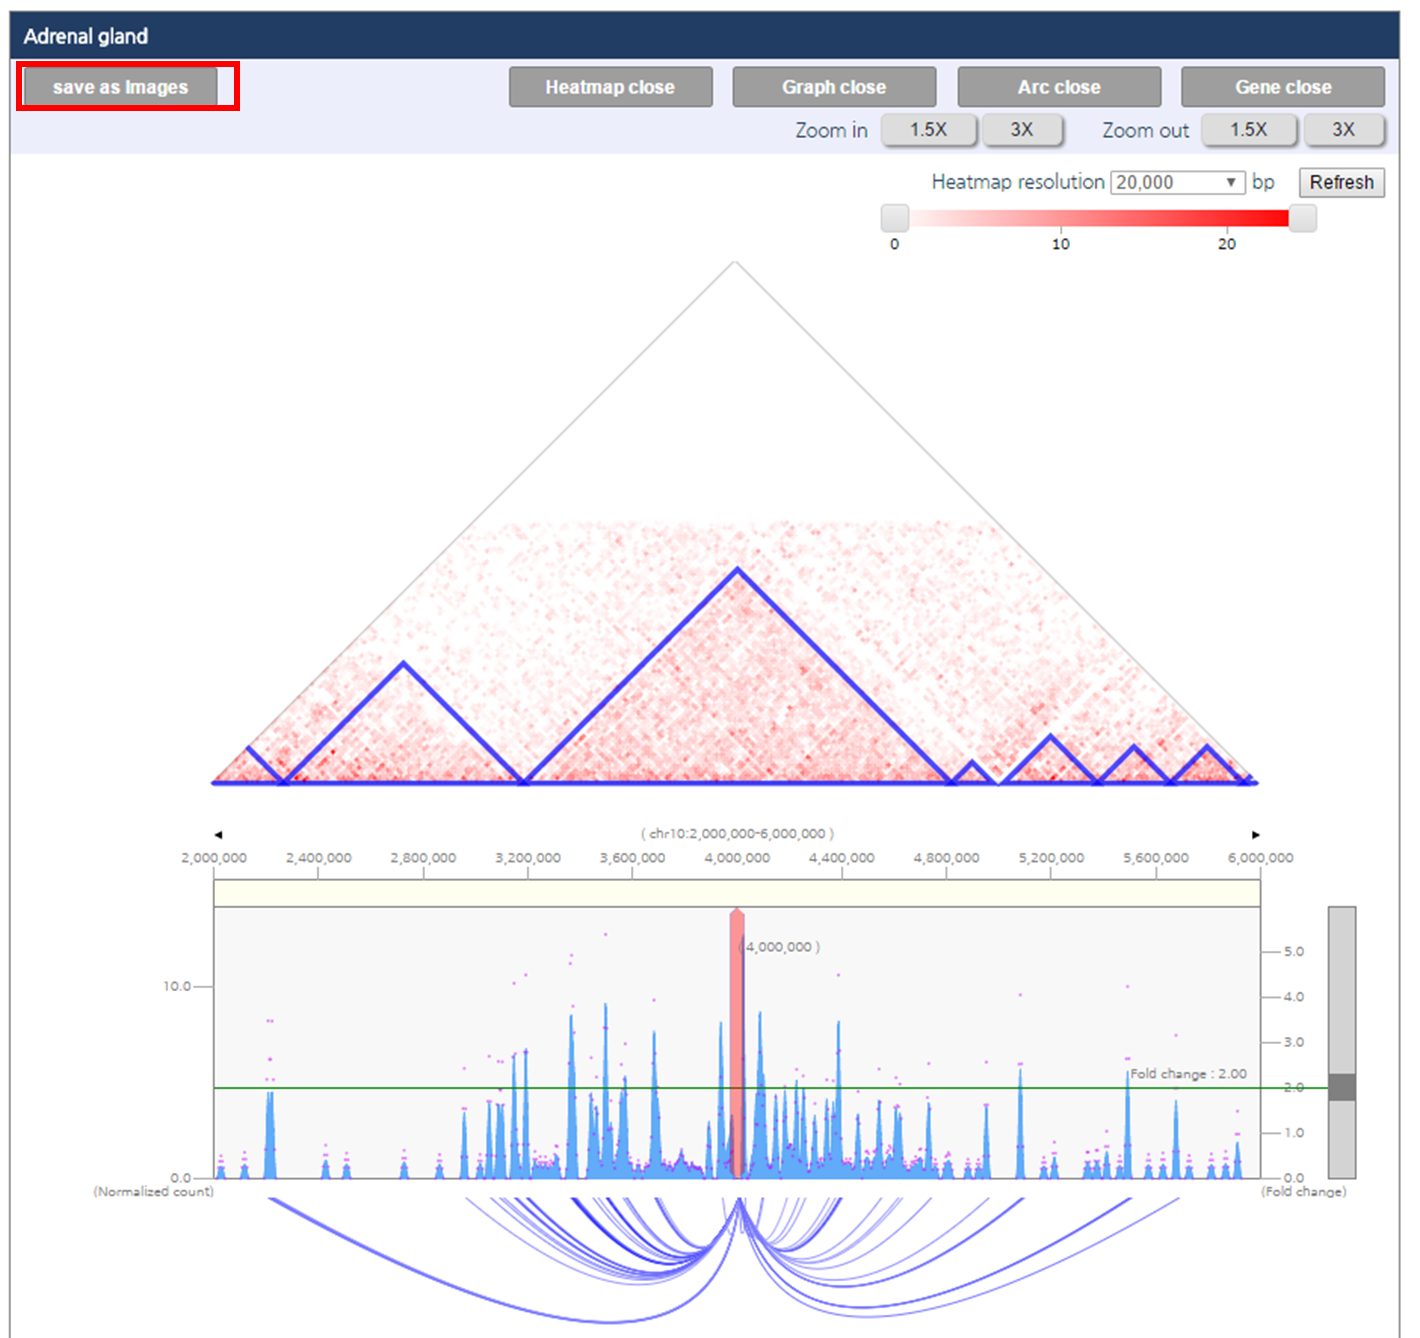
1) After visualization of chromatin interactions, click “save as images” button. Then 3DIV generate figures in SVG format, and web browser will download the figure.