- 1. Dataset and processing of cancer cell line data
- 1.1 Cell line information
- 1.2 Mutation information
- 1.3 Gene expression data analysis
- 1.4 Copy number variation data analysis
- 2. Search Menu
- 2.1 How-to search
- 2.2 Search result: Information
- 2.3 Search result: CopyNumber
- 2.4 Search result: Expression
- 2.5 Search result: Mutation
- 3. Browse
- 3.1 How-to search
- 3.2 Step:1 Overview
- 3.3 Step:2 Cell Line
1. Dataset and processing of cancer cell line data
1.1 Cell line information
We standardized all cell line names as downloaded from the Cellosaurus (ftp://ftp.expasy.org/databases/cellosaurus) database.3 Disease names were selected from the MeSH terms, and tissue names were chosen via information provided by COSMIC and CCLE databases.
1.2 Mutation information
Dataset: Since several databases did not provide the raw sequencing data, we collected the mutation information as provided from the original databases – COSMIC (http://cancer.sanger.ac.uk/cell_lines/download, Illumina exome sequencing), CCLE (https://portals.broadinstitute.org/ccle/data/browseData?conversationPropagation=begin, hybrid capture sequencing), and NCI60 (http://cancer.sanger.ac.uk/cell_lines/cbrowse/nci, Sanger and exome sequencing).
1.3 Gene expression data analysis
Dataset: Original microarray data were downloaded from COSMIC (E-MTAB-3610, Affymetrix hg U219 array), CCLE (GSE36133, Affymetrix hg U133 plus 2.0 array), and NCI60 (GSE32474, Affymetrix hg U133 plus 2.0 array).
Processing: We used Affy R package9 for RMA normalization and the hg19 genome for gene annotation. We further removed the batch effect using ComBat software.10 To compare gene expression values for the same cell line among three data sources, we calculated the percentile value of the gene expression for visualization.
1.4 Copy number variation data analysis
Dataset: CNV values were obtained from the SNP chip data in all three resources. We downloaded the raw CEL files from the CCLE (SNP array 6.0) and NCI60 (GSE32264, Affymetrix GeneChip Human mapping 500K array set) websites. COSMIC provided only the processed result, thus we downloaded the final result from the website.
Processing: Raw CEL files were processed using PennCNV-Affy package11 to obtain LRR (log R ratio) and BAF (B allele frequency) values. Then CBS algorithm12 in DNAcopy R package was used for segmentation. Again, hg19 genome was used for gene annotation. To detect copy number aberrations, we sorted out the copy number values of all genes and identified two inflection points after LOESS curve fitting. Then, genes in bottom and top 50 percentile beyond the inflection points were designated as copy number deletions and amplifications, respectively.

2. Search Menu
2.1 How-to search
You can perform a single search by Gene or Cell Line (there is an autocomplete function), or you can use Boolean Logic Expressions to enter the desired query.
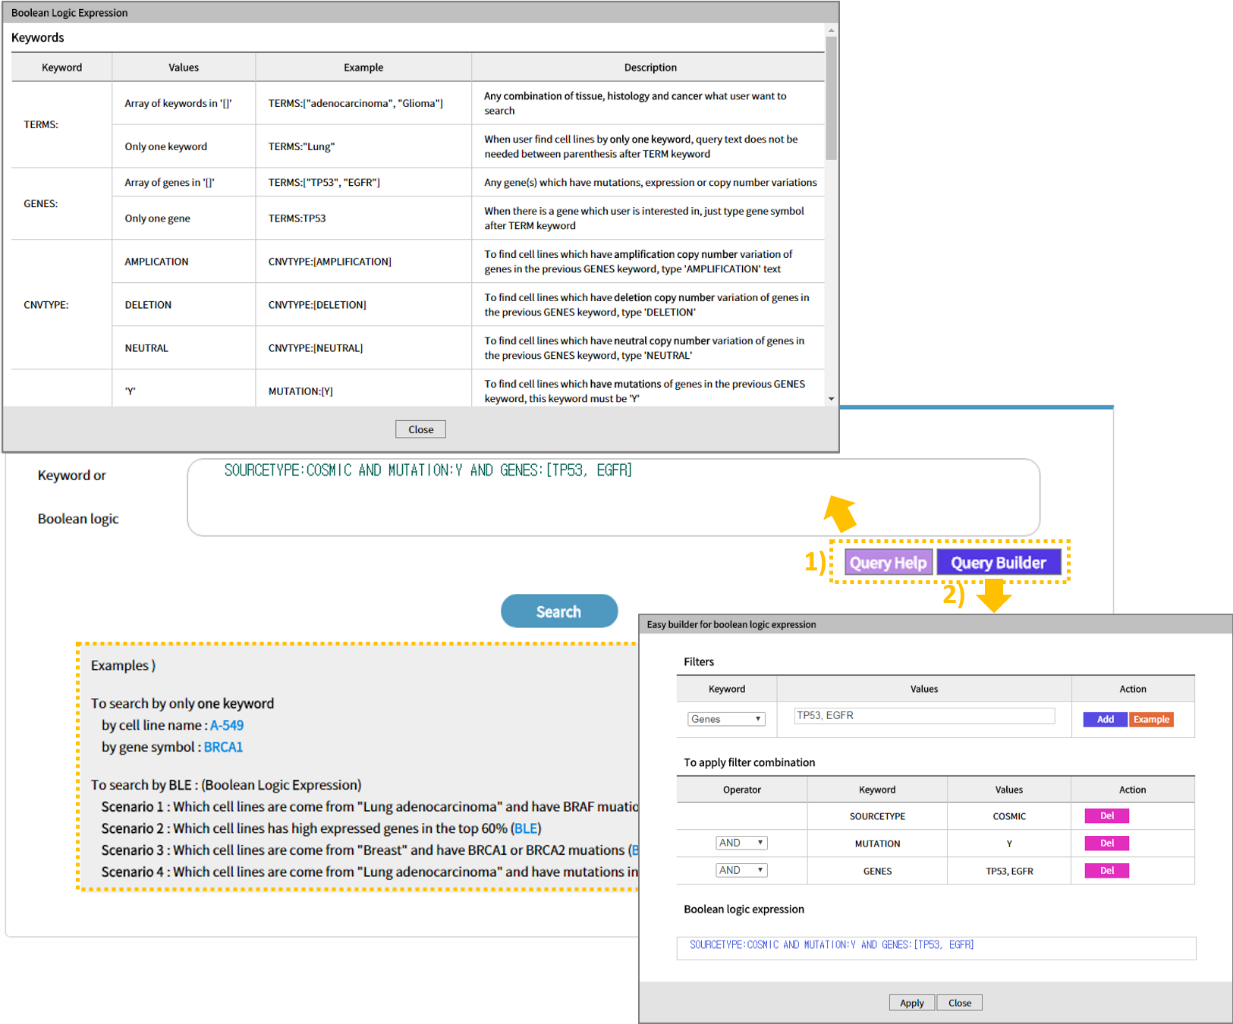
Click 1)Query Help to see the keywords that you can enter in the query. With 2)Query Builder, you can easily create a query and apply it as a search. You can test using some examples.
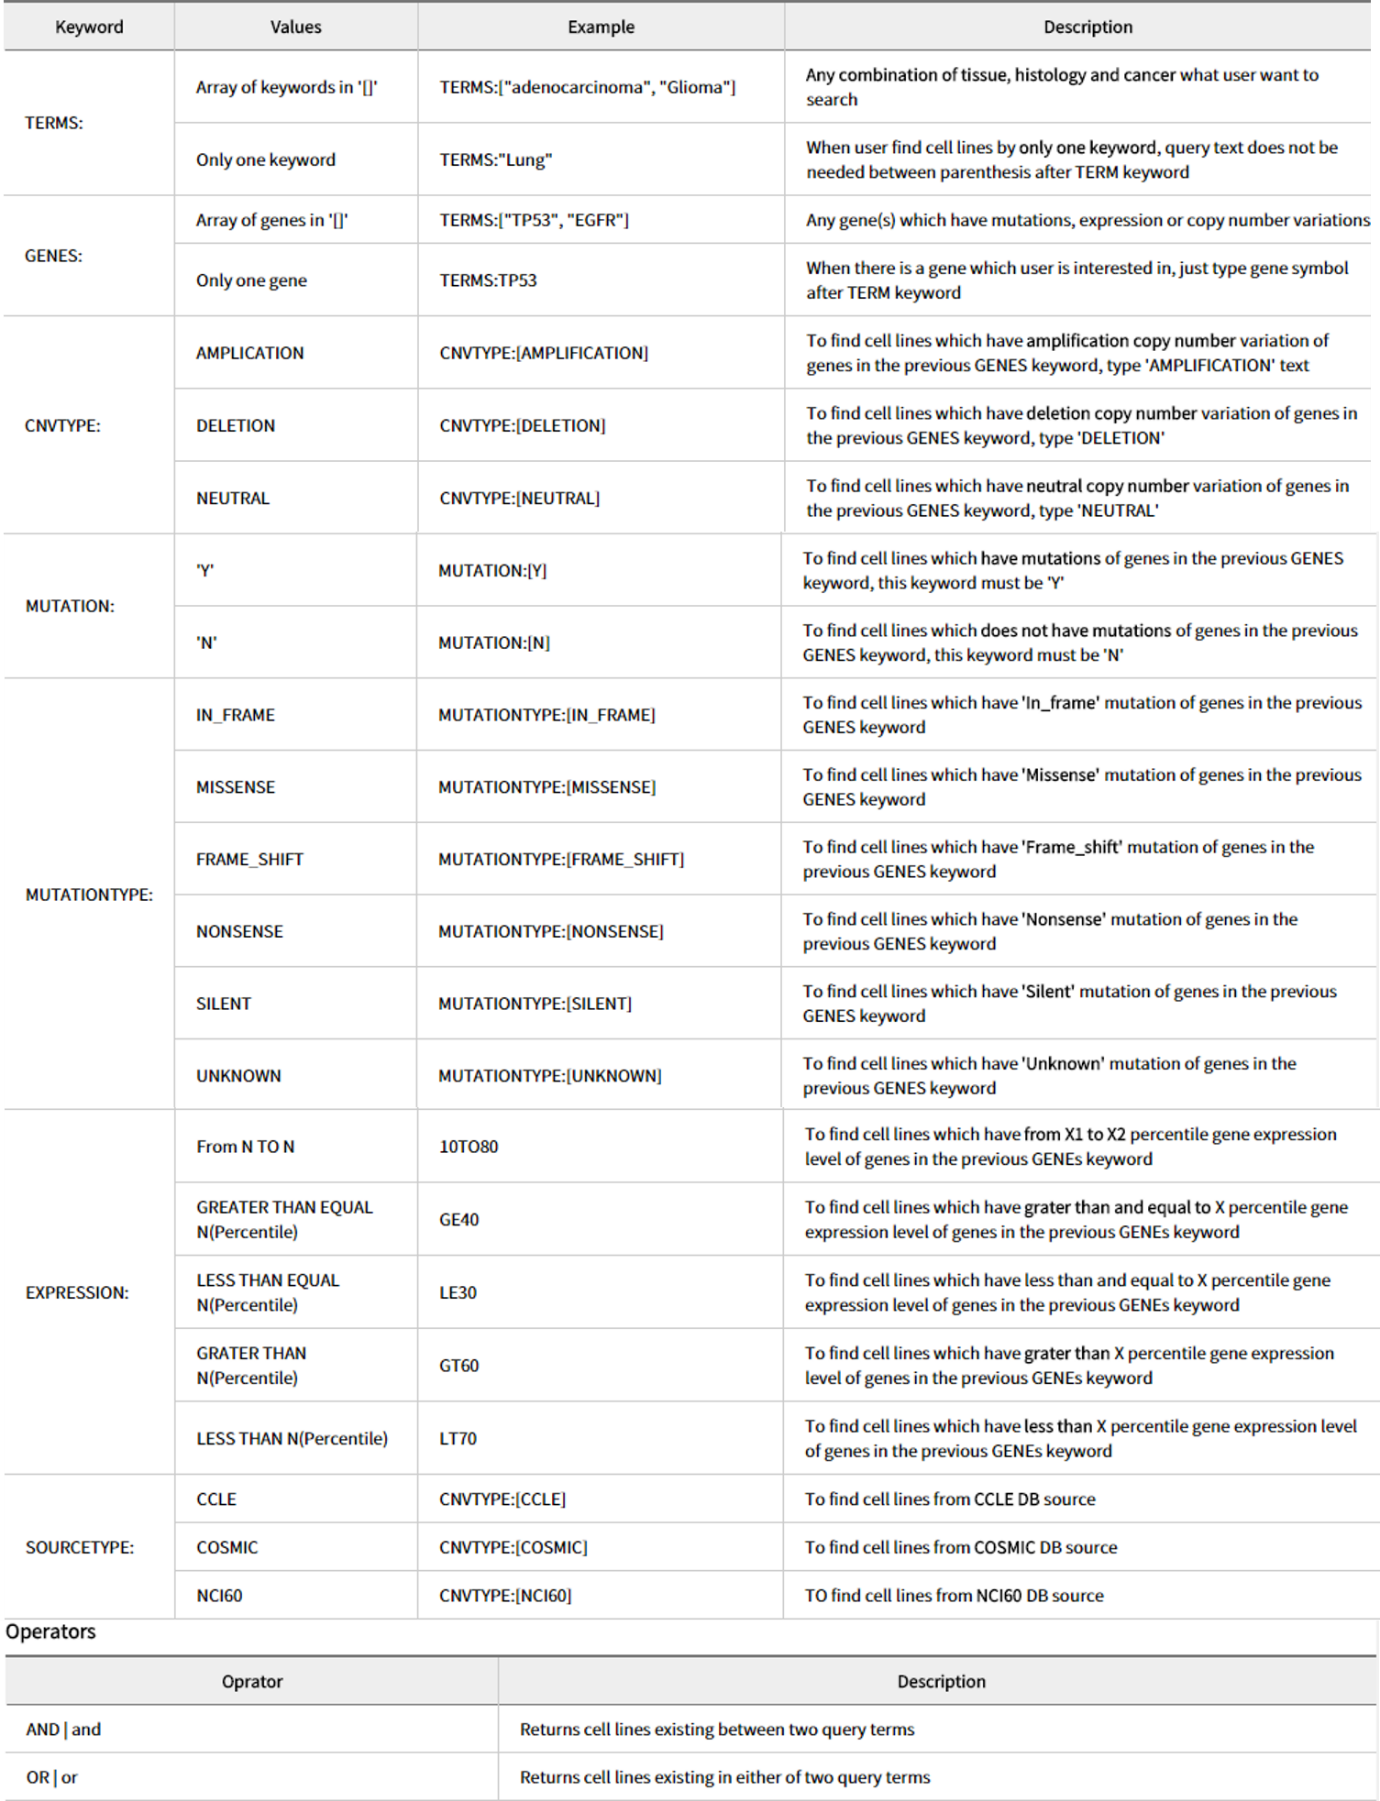
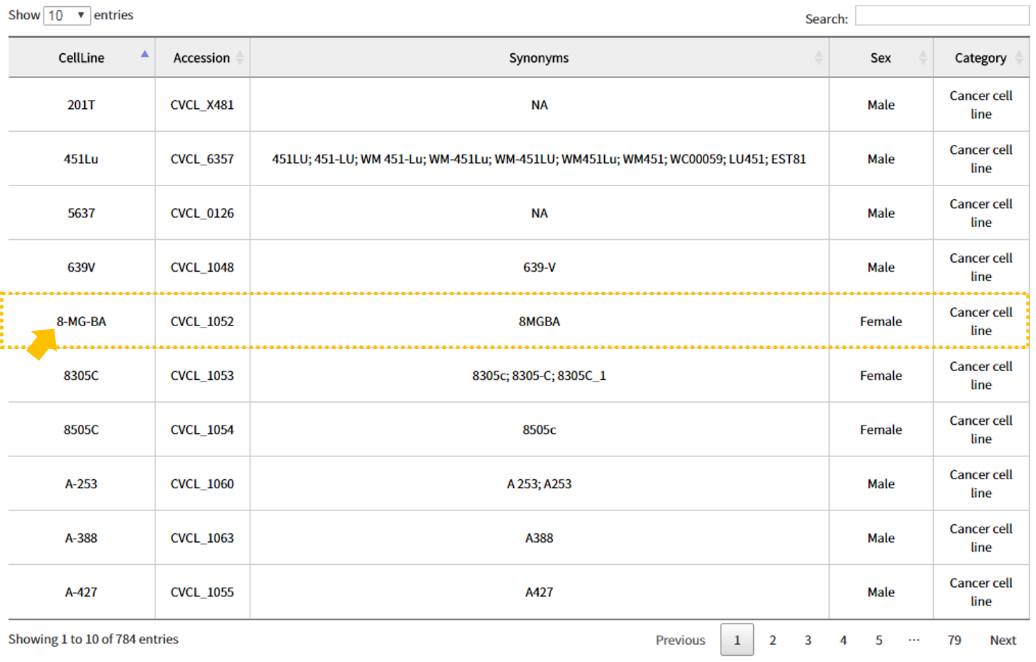
If you look closely at the query builder, you can use TERMS to decide the cancer species, GENES to select a specific gene, CNVTYPE to show the copy number, MUTATION to check the existence of a mutation, MUTATIONTYPE to determine the mutation type, EXPRESSION to select the degree of gene expression, and SOURCETYPE to specify data sources. There is a way to input a desired search keyword and a method to use Query Builder to automatically generate a search query. With the exception of search using a single keyword, the use of Boolean Logic Expressions returns a list of cell lines that match the search keyword. At this time, select the desired cell line. (The results page from a single keyword search excludes the page from which the desired cell line can be selected.)
2.2 Search result: Information
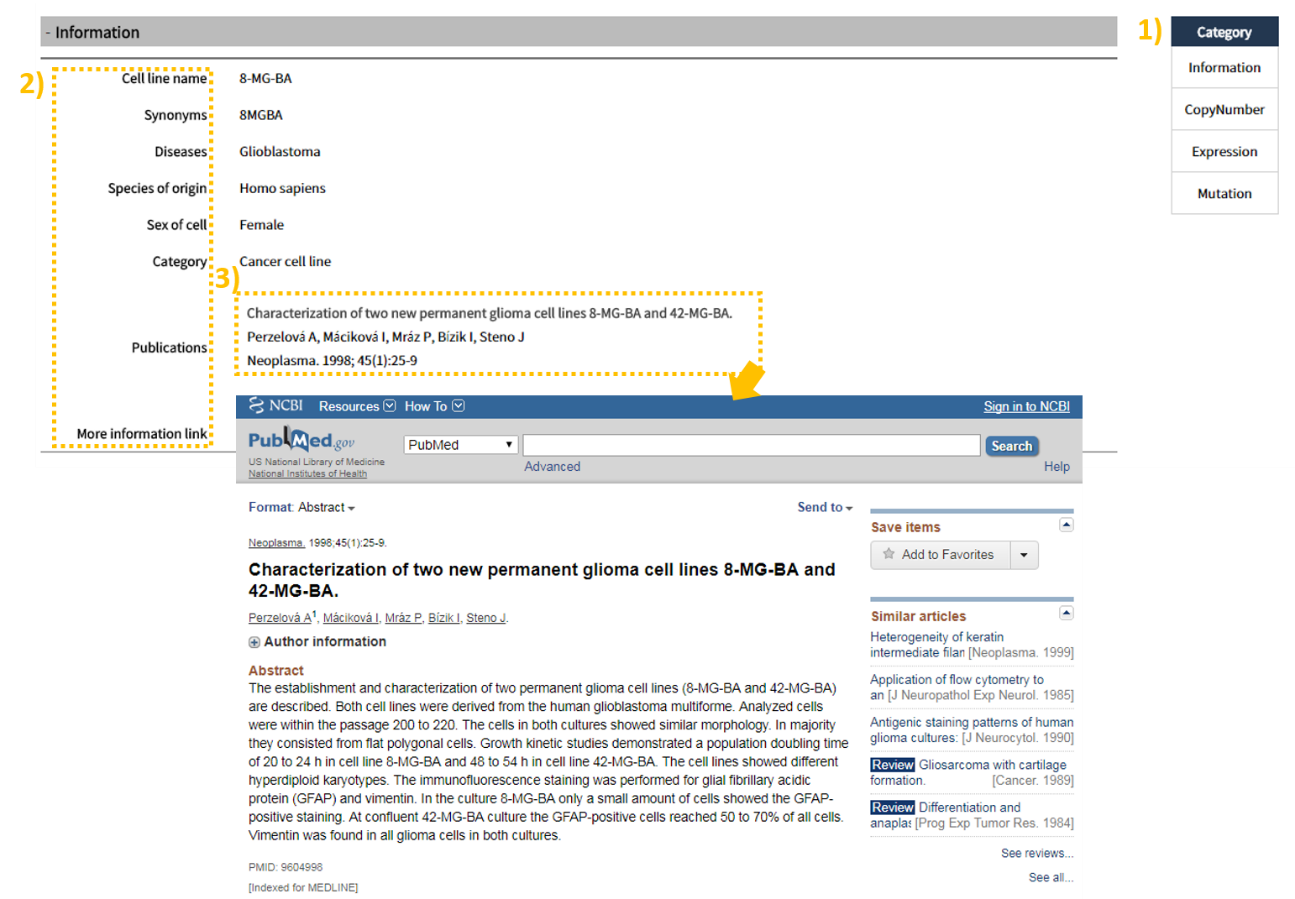
The search result window provides results through 4 panels: 1) Information, CopyNumber, Expression, and Mutation. The Information panel shows cellosaurus-collected 2) basic cell line information such as cell line name, synonyms, disease, species of origin, sex of cell, category and publication. Clicking the links for 3) publication directs the user to their associated pages.
2.3 Search result: CopyNumber
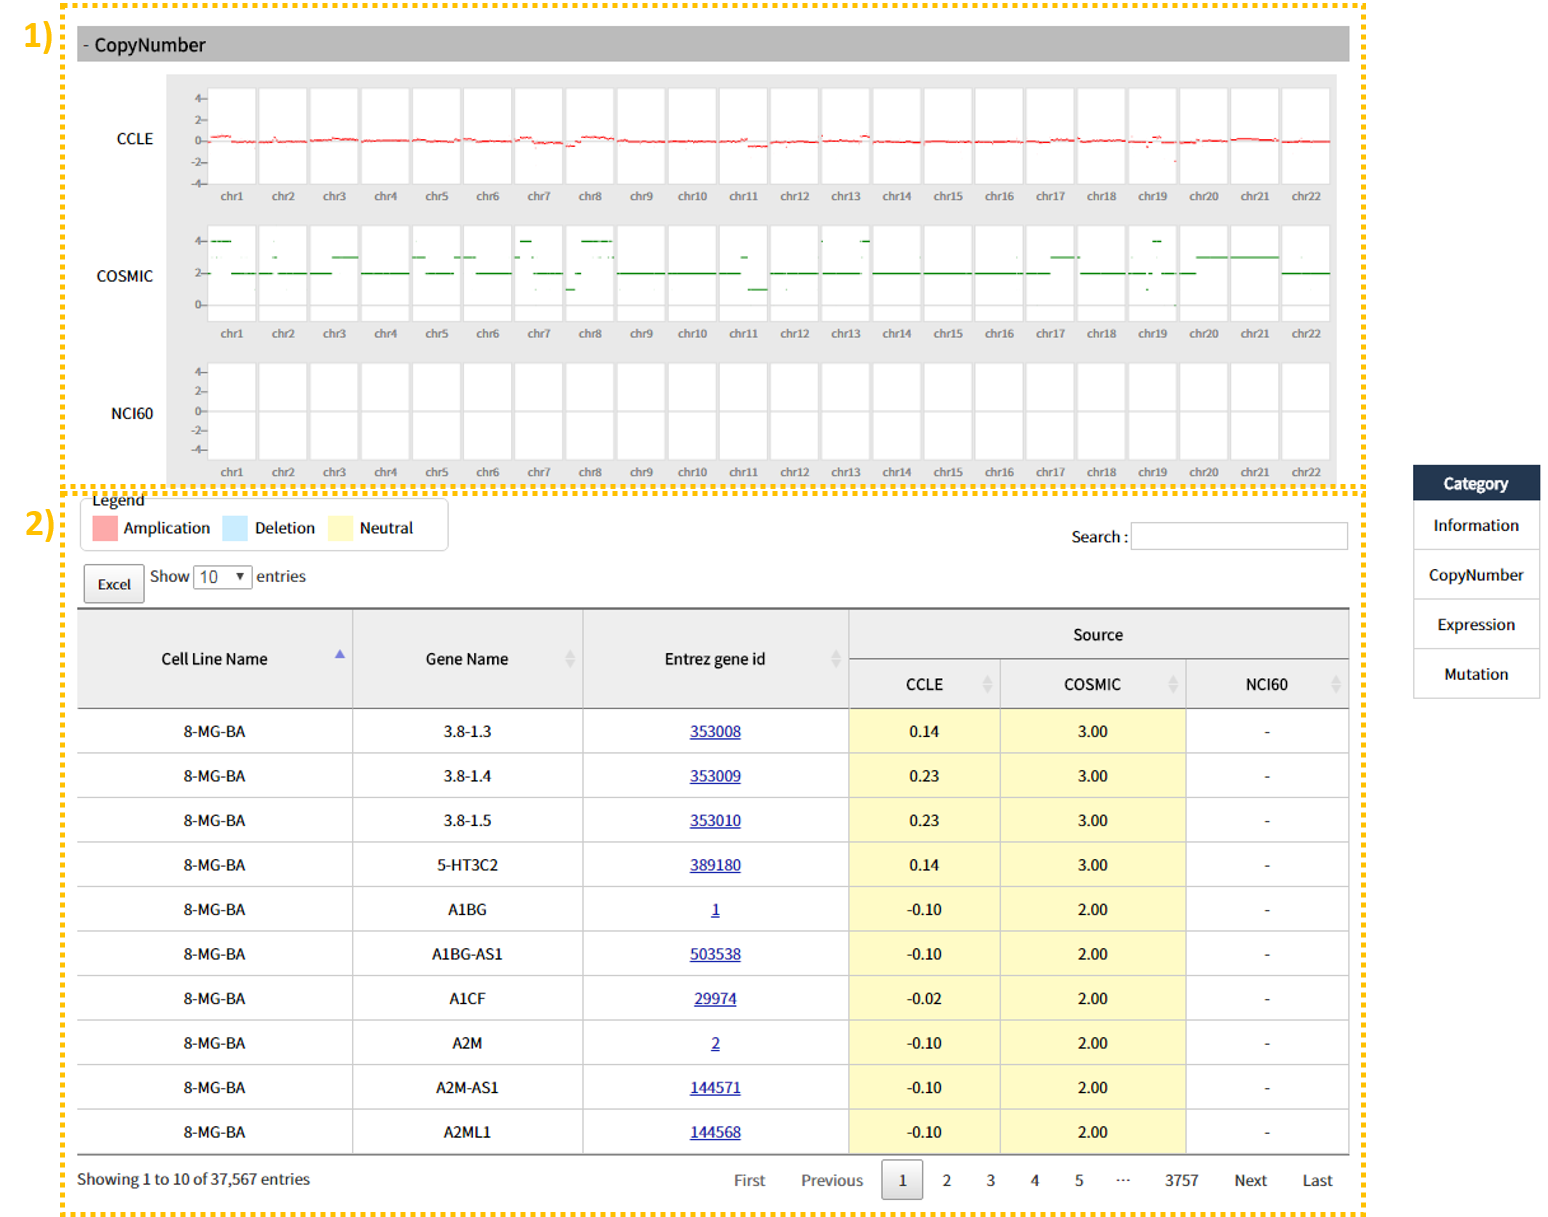
The CopyNumber tab shows 1) a visual of overall Amplification and Deletion according to each source type (CCLE, COSMIC, NCI60). 2) In the table below, the user can view copy number as a numerical value, based on which the color can be pink (Amplification), light blue (Deletion), or yellow (Neutral). In between the visual and the table, a CSV file is provided to allow the user to save the search result table, and the search window on the right can be utilized to search for a gene of interest from the table. (This function is provided for all tabs.)
2.4 Search result: Expression
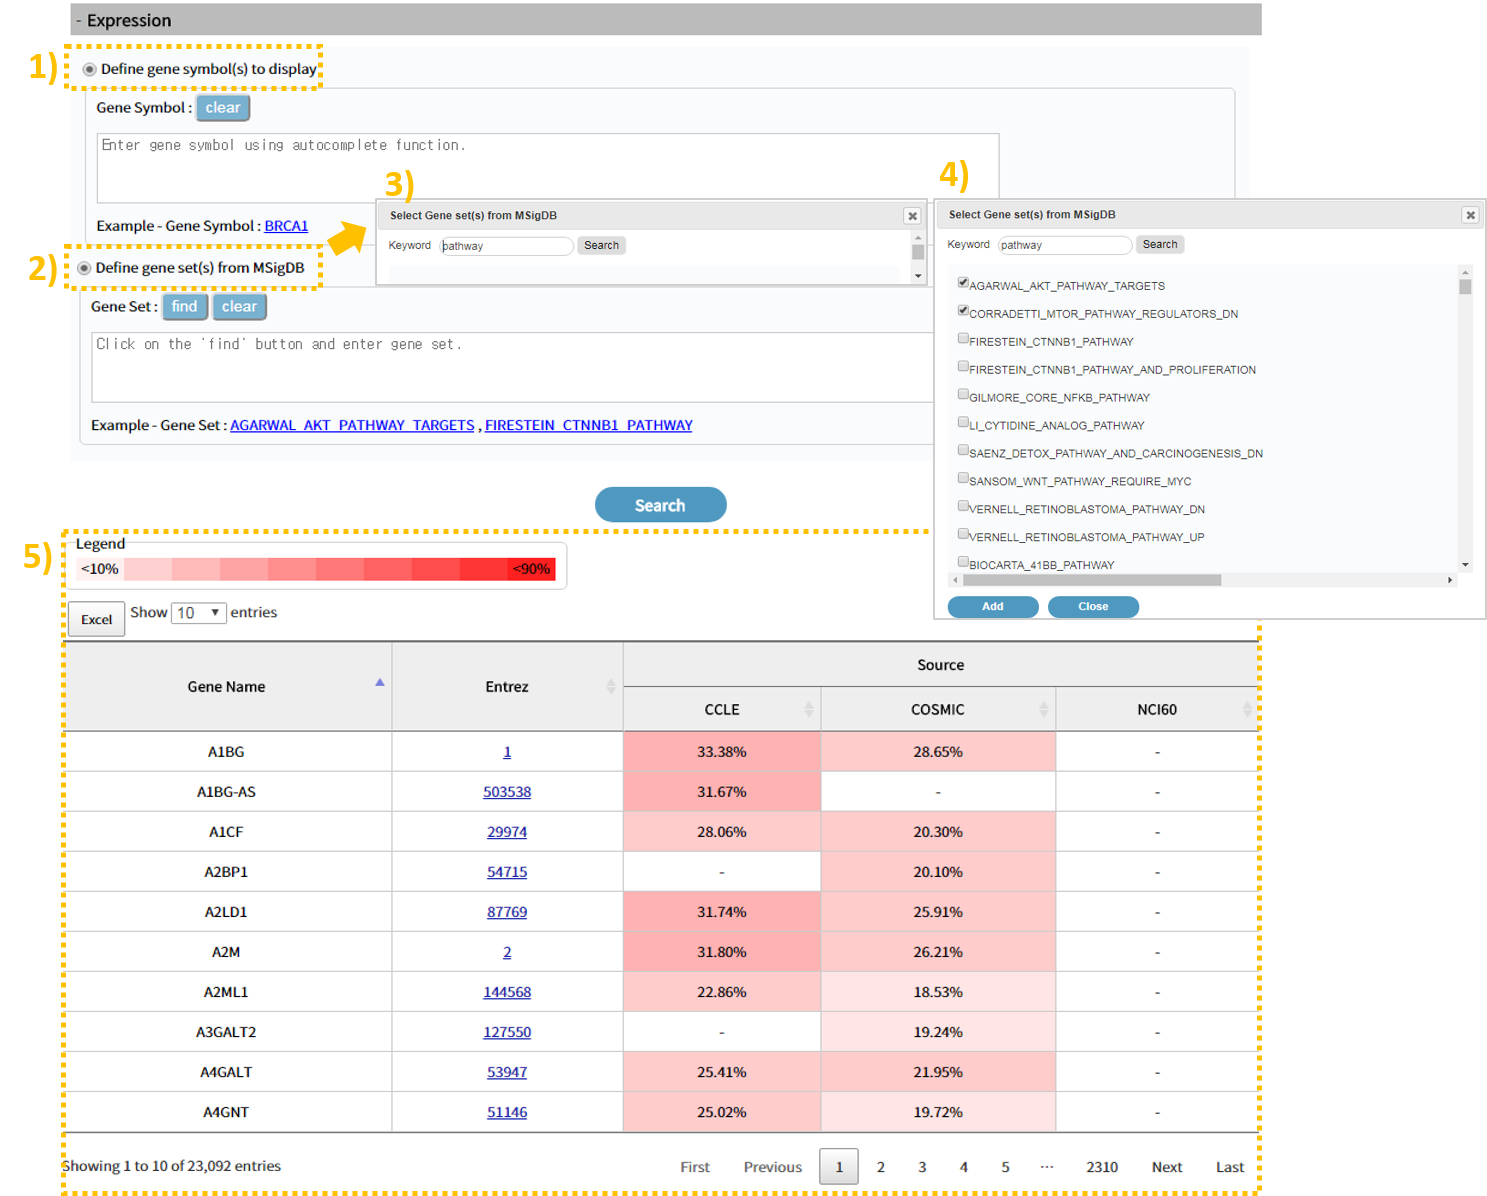
The Expression tab shows 5) gene expression by source type (CCLE, COSMIC, NCI60) through the table on the bottom. Darker the color, higher the expression level and lighter the color, lower the expression level. You can use the 1)"Define gene symbol to display" function search to check the gene expression level by entering a list of specific genes of interest, or use the 2)3)4)MisigDB gene set in the "Define gene set from MsigDB" function search to see the expression of genes in a particular pathway.
2.5 Search result: Mutation
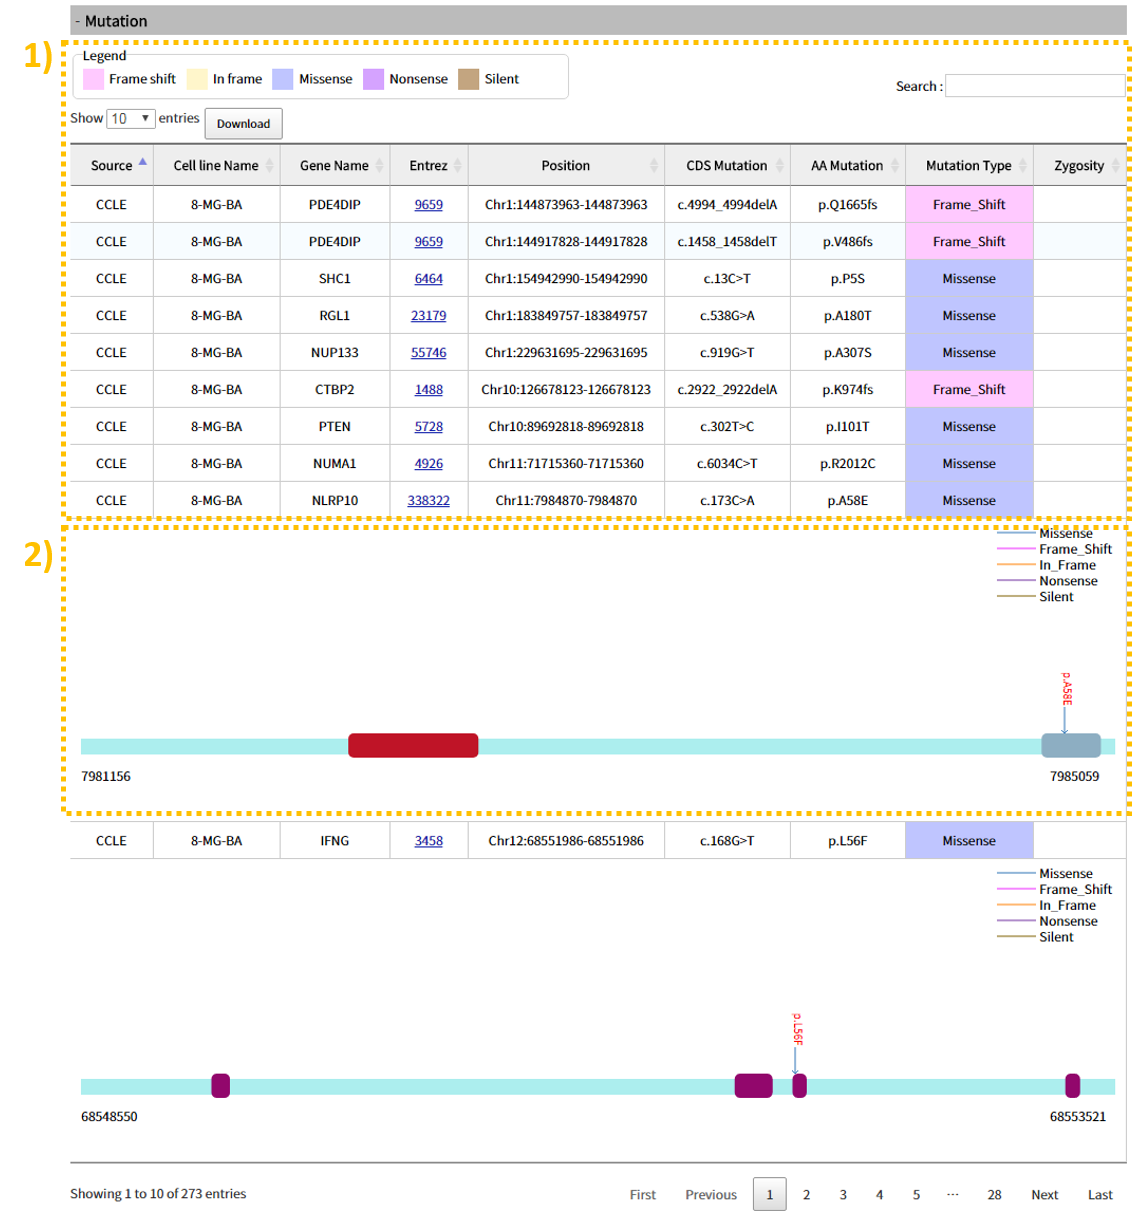
The Mutation tab provides a table with information regarding 1) Mutation location, CDS, Amino Acid, mutation type, etc. Clicking a table row shows 2) a visual of which mutation types are around the gene's mutation.
3. Browse
3.1 How-to search
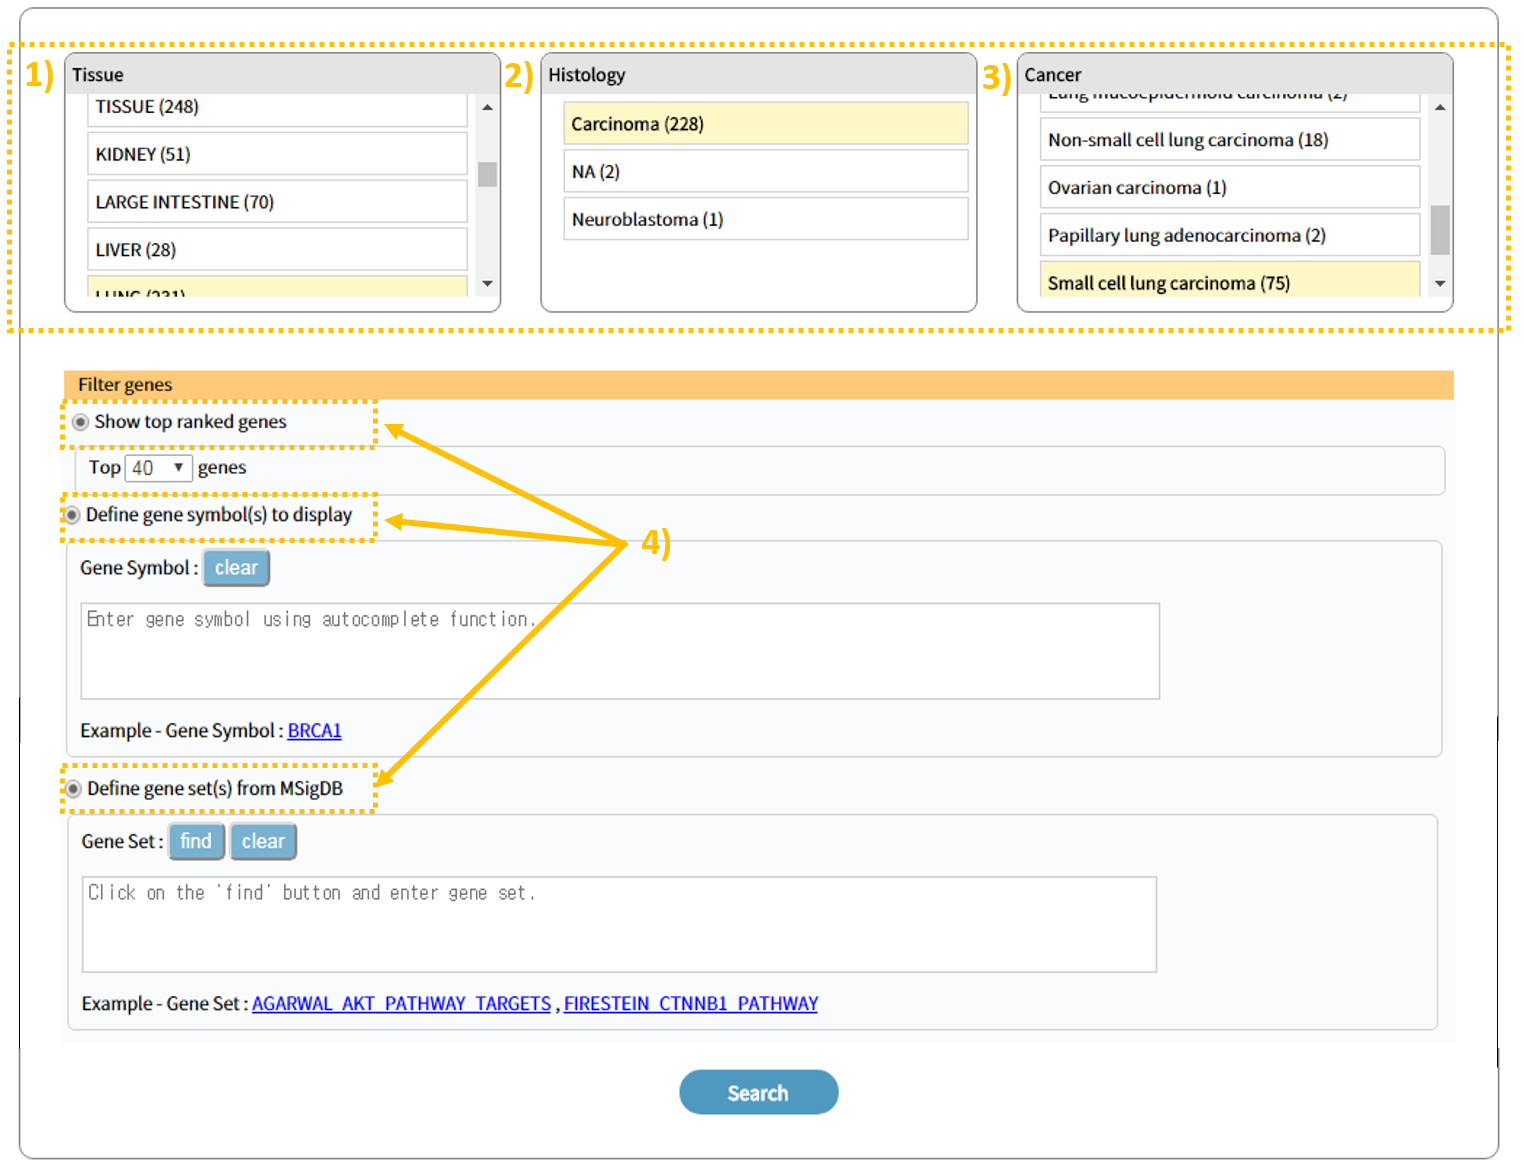
1)2)3) Search results are available after selecting in order the tissue, histology, and cancer type of interest. 4)To view search results for a specific gene, enter in Gene set(s) a user-defined gene symbol and/or a gene symbol from MsigDB and press search. To view search results for a gene within a specific pathway, search through Search gene set(s) from MsigDB. Afterward the user can view genes according to the number entered in Top ranked genes.
3.2 Step:1 Overview
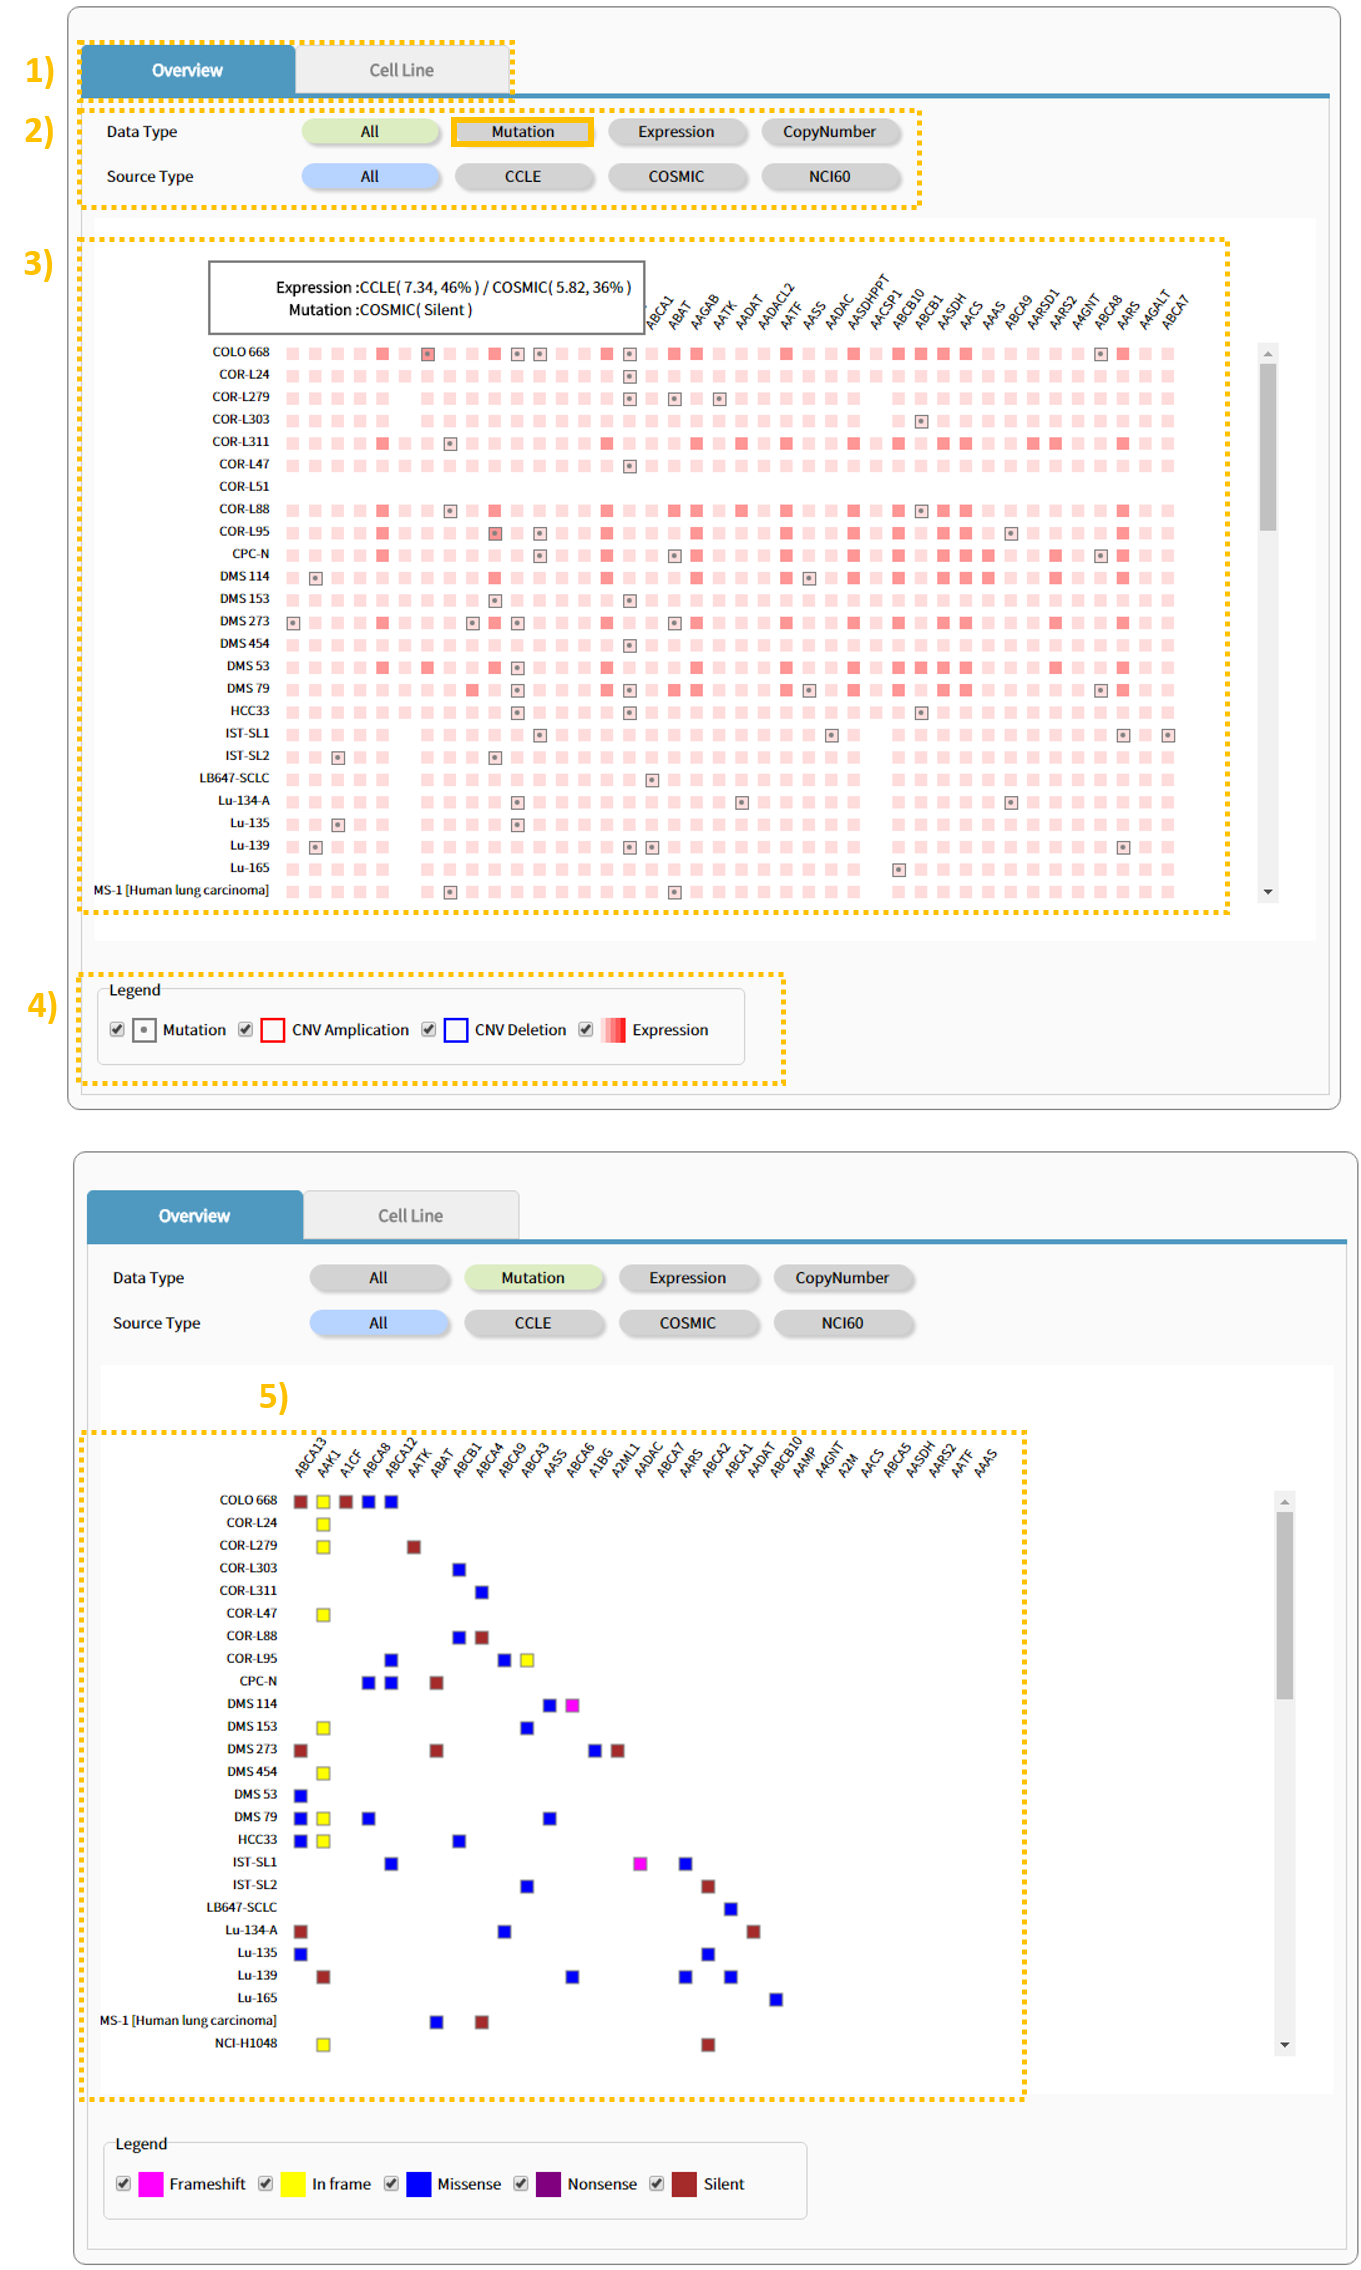
The Search Result window provides results through Overview and cell line panels. The Overview tab shows a plot that enables the user to view all variants for each gene within the cell line of a selected cancer type. 2) The plot can be re-created according to desired data type or source type, and 4) the user can specifically filter for and view a variant of interest. 5)Clicking on the Mutation tab will filter out the expression and Copy Number values, leaving only the mutation information.
3.3 Step:2 Cell Line
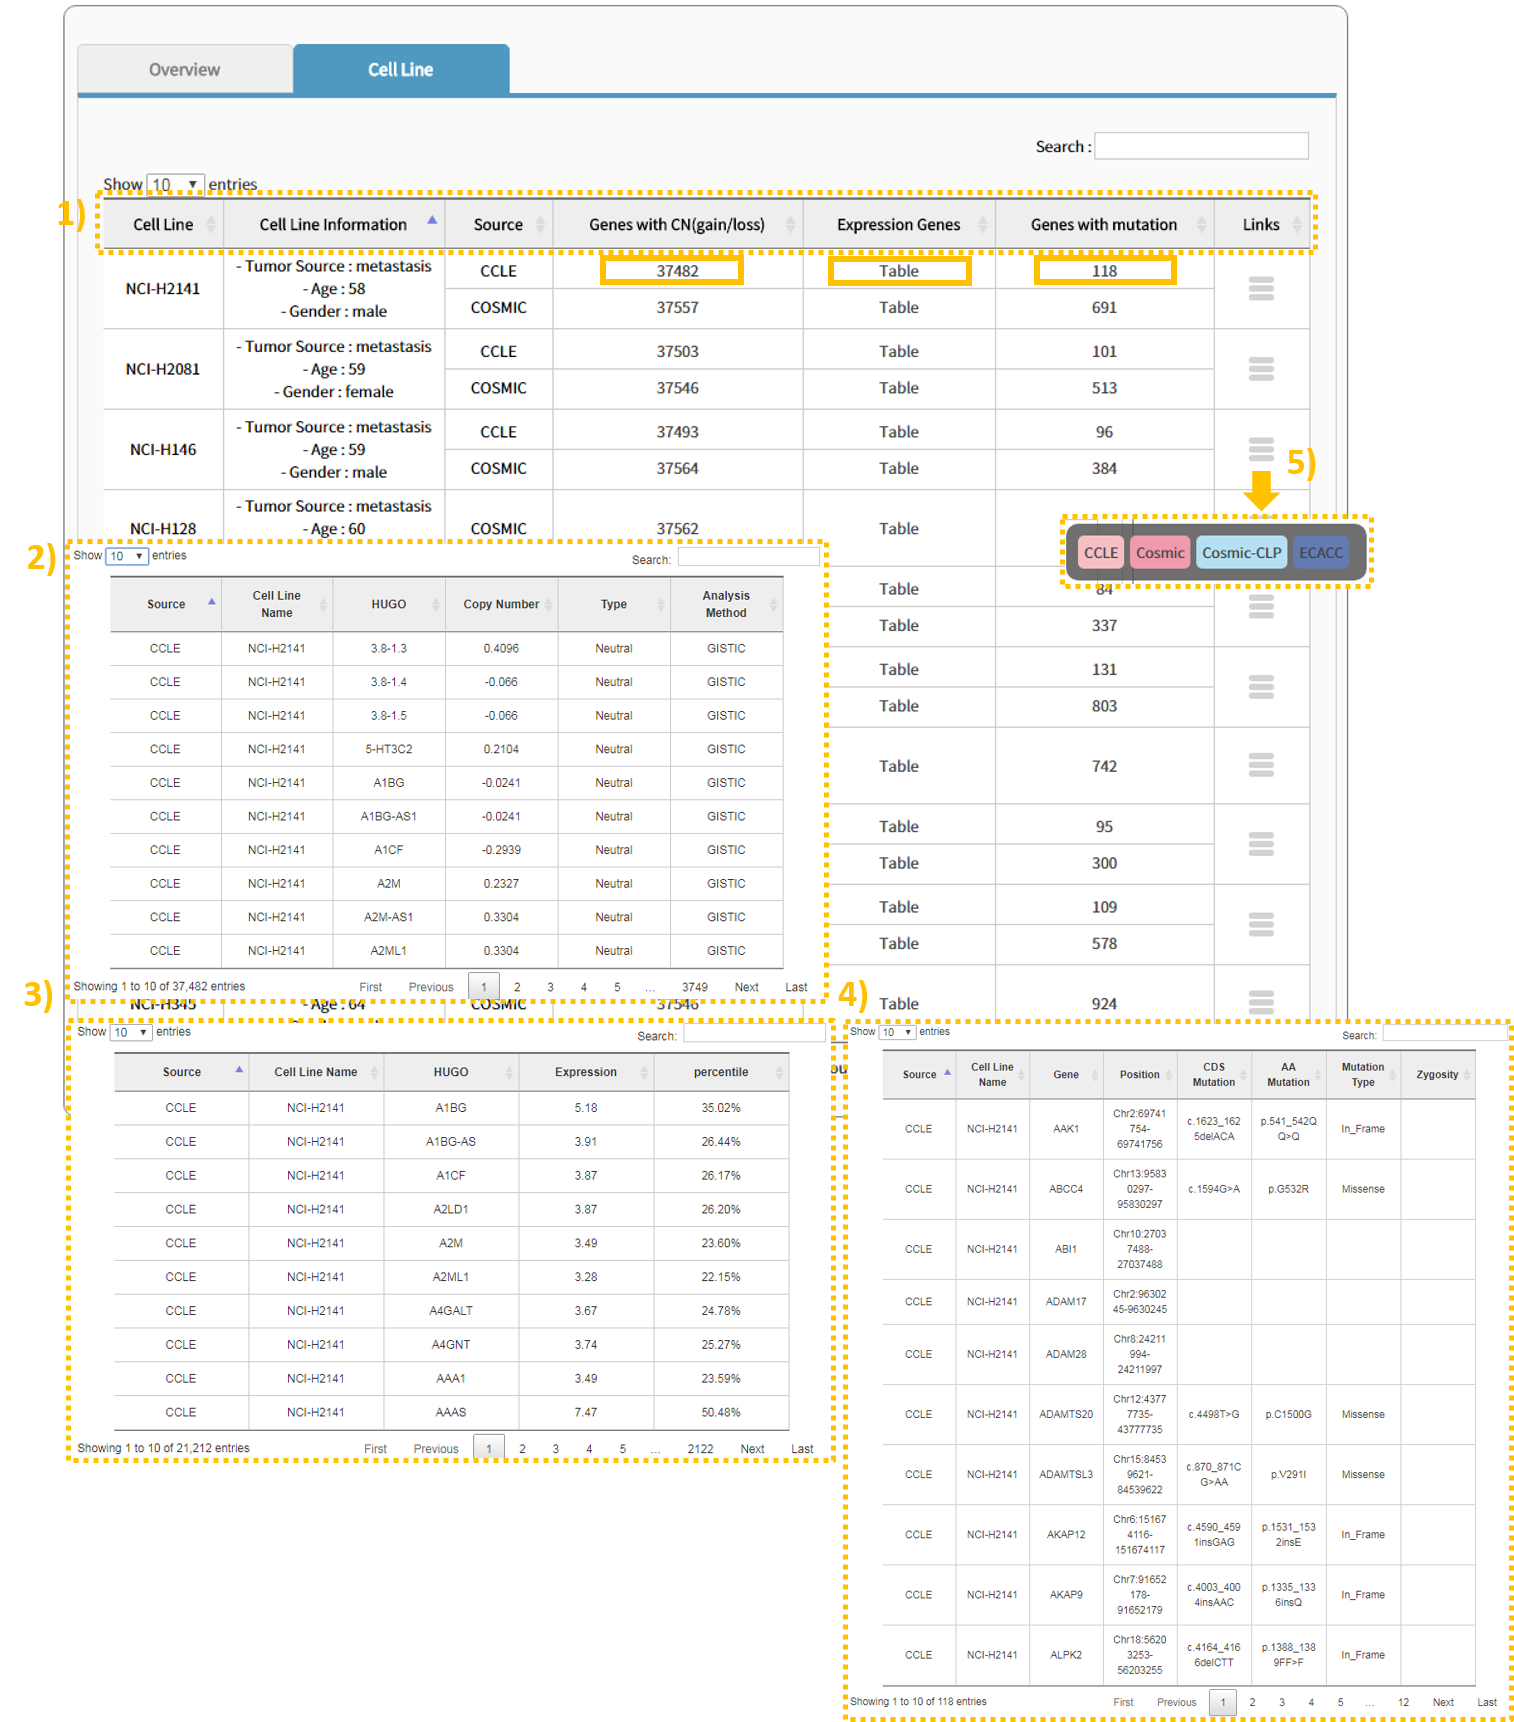
1) The Cell Line tab shows 1) links containing information regarding the cell line of the selected cancer type, basic information, and source, number of genes with gained/lost copy numbers, number of genes with an expression table and mutation, and cell line information. 2), 3), 4) Clicking the text within a column enables the user to view the applicable table. 5) Clicking a link provides a site that carries information for the applicable cell type.
